Total farm support eroded by underspend and inflation
Thursday, 26 September 2024
The funding pot for agriculture in the UK has remained constant at £2.4 billion since the 2019-24 parliament. As we approach the first budget of the newly elected government, we examine how farming costs have changed in line with inflation and what this means for the agricultural budget in real terms going forward.
Key points
- Farm input prices* increased overall by 44% between December 2019 and May 2024
By sector, input prices increased by:
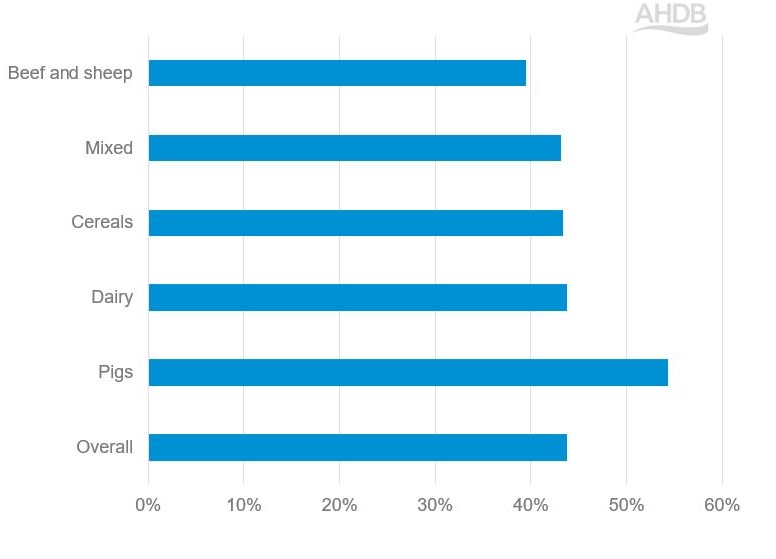
- 54% for pig farming, with feed prices the main driver
- 44% for dairy farms, with feed prices making a considerable contribution
- 43% for cereals and mixed farms, with fertiliser and machinery related costs key drivers
- 39% for beef and sheep farms, with feed costs the main driver
- The current farming budget would need to increase by at least £1 billion to £3.4 billion just to negate the effect of inflation.
*Calculations are based on cereals, mixed, beef and sheep, dairy and pig farms which accounted for 73% of all farm types in England (2018 – 2023 average).
What ‘basket of goods’ have we considered?
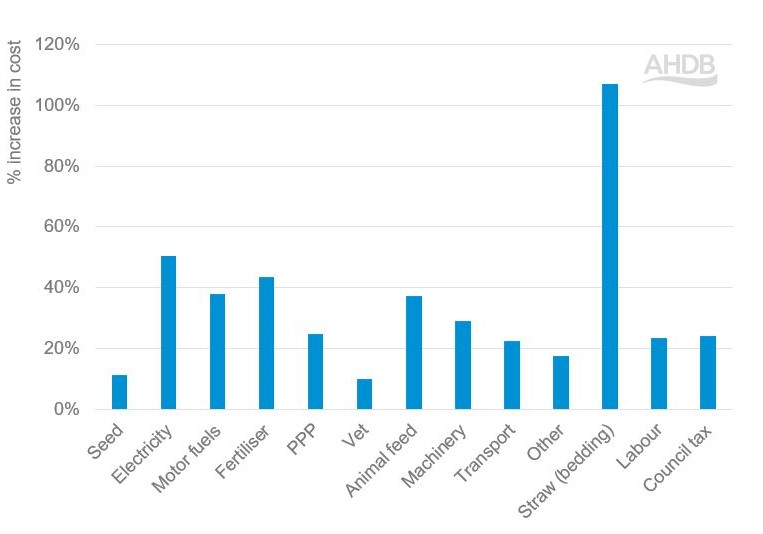
Consumer price inflation is calculated based on a ‘basket of goods’ representing goods and services consumed by ‘typical’ household. In this analysis, our ‘basket of goods’ is based on typical costs incurred by farms. Figure 1 shows the goods and services we have considered and the percentage change in their costs from December 2019 to May 2024.
Interest rates on loans and overdrafts were also included in the basket but are omitted from Figure 1 as they increased by 600% and so obscure the changes seen for other goods and services.
Figure 1. Percentage change in farm inputs and services (December 2019 – May 2024)

Source: Defra, AHDB, ONS, Bank of England, DLUHC
PPP – plant protection products
Straw costs (bedding) more than doubled between December 2019 and May 2024, with electricity, fertiliser, animal feed and motor fuels increasing by 38–50% over the period.
Methodology
Different types of farm will use varying combinations of farm inputs. For example, a cereals farm with no livestock will not be affected by animal feed costs. Similarly, a pig farm is unlikely to be affected by costs related to plant protection products (PPP).
For cereals, mixed, beef and sheep, dairy and pig farms we calculated the proportion of which the goods and services shown in Figure 1 (plus interest rates on loans and overdrafts) comprised total costs for each type of farm. Cost profiles were built using the AHDB virtual farms and AHDB cost of production data.
A weighted average of input cost increases was calculated for each type of farm as well as an overall weighted average across the five types of farm.
Farm input costs increased by 44% between December 2019 and May 2024
Figure 2 shows the increase in farm input costs for different farm types from December 2019 to May 2024.
Figure 2. Percentage change in farm input costs by sector (December 2019 – May 2024)

Source: AHDB
On average, across the five farm types, costs increased by 44%, with pig farms experiencing the greatest increase in costs, mainly due to rising feed prices. Animals feed costs were the main driver for increases in livestock farm costs. Fertiliser and machinery contributed the most to cereals farm costs.
Over the same time period, according to the consumer price index (CPI), food and non-alcoholic beverage prices increased by 22%.
Meanwhile, the agricultural budget has remained constant over the same period…
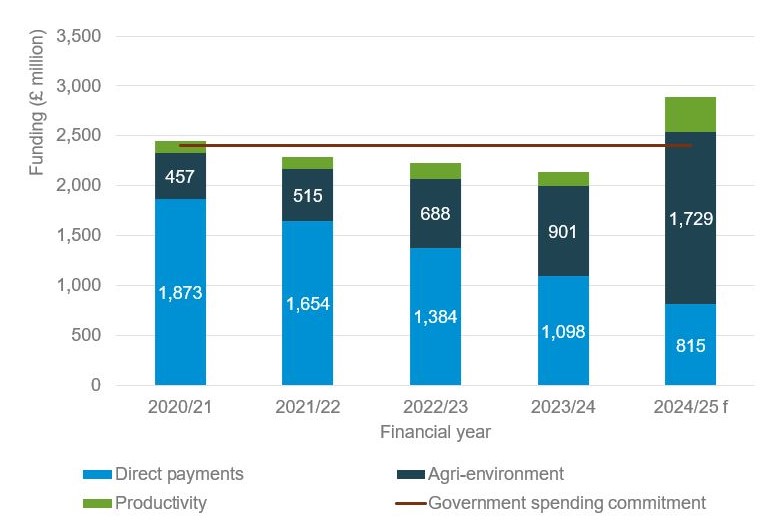
During the 2019 to 2024 parliament, the previous government committed to maintaining an overall farm support budget at around £2.4 billion per year. As direct payments have declined, the percentage of total spend on the environment, climate and animal welfare within this budget has increased.
Over this period, the impact of this total funding pot has been limited by two factors – underspend and inflation. Over the past three financial years (2021/22 to 2023/24), data shows an underspend by the government, as shown in Figure 3. However, the latest NAO report on the Farming and Countryside Programme states that Defra expects to spend £2.9 million in 2024/25.
While farm input costs increased by more than 40%, the total funding pot for agriculture has remained constant at £2.4 billion since 2019, thus eroding its value in ‘real’ terms (i.e. taking inflation into account).
Figure 3. Funding for agriculture in England 2020/21 – 2024/25

Source: National Audit Office (NAO) analysis of Defra data
f – forecast
*The accounting recognition point for the Sustainable Farming Incentive (SFI) is the day before the anniversary of the start date. Some applications (worth £200 million) that start in 2024/25 will not be accounted for until 2025/26. The NAO have included this £200 million in the 2024/25 spend.
Bigger pot of funding needed to account for inflation
Farm input costs increased by 44% between December 2019 and May 2024. The total farming budget has remained constant, until now, at £2.4 billion. To account for the effect of inflation, the farming budget would need to increase by 44% to £3.4 billion. This is without considering any other spending required to support the farming sector.


