- Home
- Markets and prices
- Dairy markets - Supply and demand - Dairy production - Global milk deliveries
Global milk deliveries
Updated 8 January 2026
Trends in global milk supplies impact on prices. Deliveries in the six key exporting regions are tracked to provide an overview of current production levels and trends in global milk supplies.
The milk production regions included are the EU-27, UK, Argentina, Australia, New Zealand and the USA.
Combined, they account for more than 65% of global cow's milk production and around 80% of global exports of dairy products.
Overview
-
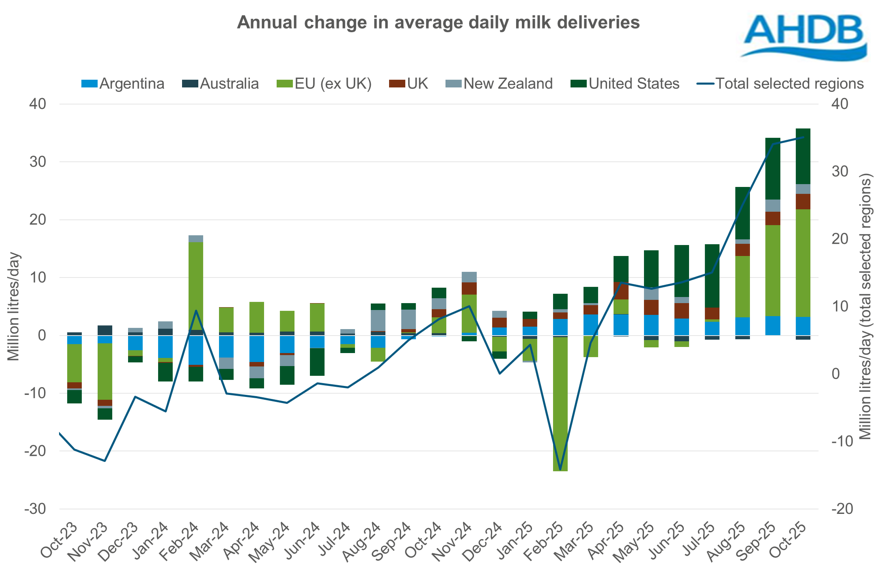
Global milk deliveries averaged 864.6 million litres per day in October, an increase of 35.1 million litres per day (+4.2%) across the selected regions, compared to the same period last year
-
Milk deliveries in the EU averaged 381.5 million litres per day in October, a substantial increase of 18.6 million litres per day (+5.1%) compared to the same month of the previous year, and the strongest October on record. Recovery from bluetongue in some of the major milk producing countries as well as strong dairy economics boosted volumes
-
Looking at the EU figure in greater detail, we saw the greatest year on year volume increase from Germany, up 168.5 million litres (+6.8%), followed by France, up 109.4 million litres (+6.0%), and the Netherlands, up 83.7 million litres (+7.9%)
-
UK daily deliveries averaged 42.2 million litres per day in October, up 6.8% compared to last year. Milk flows reached new highs amid favourable dairy economics
-
US production was up 3.6% year-on-year, with production at 276.5 million litres per day in October. Increasing herd size, yields and improved margins have been drivers of growth. However, recent reports document a shift to cull more cows with falling milk prices but there is a long way to go considering US cow numbers in October were up by 208,000 year-on-year
-
Australia recorded a decrease in production year-on-year, with deliveries down by 0.7 million litres per day (-2.4%) compared to last year, to sit at an average of 28.9 million litres per day. Production was a mixed picture across regions but dry weather conditions, ongoing feed shortages and a smaller milking herd in drought-affected areas continued to impact production
-
New Zealand deliveries were up by 1.6 million litres per day (+1.7%) compared to last year with October average daily deliveries at 98.1 million litres per day. High farmer confidence supported by positive milk prices and higher feed input increased milk flows
-
Argentina’s deliveries were up by a substantial 3.2 million litres per day (+9.4%) in October, against low 2024 volumes. Growth is now slowing as farmer margins come under pressure

Additional information
- The tracker is a baseline for comparing against actual production, not a forecast of milk production
- The baseline is calculated using historic month-on-month movements in milk production, providing information on a typical milk year in each of the key regions
Download dataset
While AHDB seeks to ensure that the information contained on this webpage is accurate at the time of publication, no warranty is given in respect of the information and data provided. You are responsible for how you use the information. To the maximum extent permitted by law, AHDB accepts no liability for loss, damage or injury howsoever caused or suffered (including that caused by negligence) directly or indirectly in relation to the information or data provided in this publication.
All intellectual property rights in the information and data on this webpage belong to or are licensed by AHDB. You are authorised to use such information for your internal business purposes only and you must not provide this information to any other third parties, including further publication of the information, or for commercial gain in any way whatsoever without the prior written permission of AHDB for each third party disclosure, publication or commercial arrangement. For more information, please see our Terms of Use and Privacy Notice or contact the Director of Corporate Affairs at info@ahdb.org.uk © Agriculture and Horticulture Development Board. All rights reserved.
Sign up to receive the latest information from AHDB.
While AHDB seeks to ensure that the information contained on this webpage is accurate at the time of publication, no warranty is given in respect of the information and data provided. You are responsible for how you use the information. To the maximum extent permitted by law, AHDB accepts no liability for loss, damage or injury howsoever caused or suffered (including that caused by negligence) directly or indirectly in relation to the information or data provided in this publication.
All intellectual property rights in the information and data on this webpage belong to or are licensed by AHDB. You are authorised to use such information for your internal business purposes only and you must not provide this information to any other third parties, including further publication of the information, or for commercial gain in any way whatsoever without the prior written permission of AHDB for each third party disclosure, publication or commercial arrangement. For more information, please see our Terms of Use and Privacy Notice or contact the Director of Corporate Affairs at info@ahdb.org.uk © Agriculture and Horticulture Development Board. All rights reserved.

