Q2 2026 dairy market review

Wednesday, 15 July 2026

Key points

  • GB milk supplies have been dwindling with spring volume management and then a series of heatwaves constraining supplies
  • Markets saw some decline due to global milk supplies but have found support with the heatwave supply pressures
  • Milk prices have seen some positive announcements but more holds, awaiting direction
  • Retail demand is steady with growing consumer demand for protein supporting the category

Milk production

GB milk deliveries through Q2 went into decline, as low milk prices, volume management schemes and then a series of heatwaves came to roost.

April saw -0.1%, May -0.9% and June -3.1% year on year meaning the calendar year to date is now up by 0.6%. The milk year is declining by -1.7% however. 

The milk to feed price ratio is now edging down into the ‘stabilisation zone’, indicating that milk supply growth should normalise although will remain at high levels. 

GB milk production for the 2026/27 season is forecast to decline to 12.91bn litres, 0.9% lower than the previous milk year according to our June forecast update. This will be driven by the following factors:

  • Herd numbers down 2%
  • Volume management schemes
  • Declining milk-to-feed-price ratio with margin pressures

The GB milking herd totalled 1.59 million head as of April 2026, the lowest seen and a 2.0% decline from the same month the previous year with a decline across all age groups with the exception of 4–6-year-olds.

There could be shortages of available heifer replacements as the growth in beef/dairy crosses continues.  Whilst this highlights growing efficiencies in dairy production there is a balance and the industry could be vulnerable to future disease outbreaks putting pressure on cow numbers. 

It is estimated that there were 6,850 dairy producers in GB as of April 2026. This is a substantial reduction of 160 producers (-2.3%) which was estimated since our last survey in October 2025.

There was an estimated decline of 190 producers (-2.7%) compared to the previous year indicating that the majority of the industry exits took place last winter.

Favourable dairy economics during the summer months would have stemmed the flow of producers leaving the industry. However, this accelerated during the winter months as margins were squeezed following the decline in milk prices, forage shortages for some and increasing input costs.

GB organic milk deliveries dipped into year-on-year decline from May 2026 and have remained well below the 5-year average. Milk year to date (April to 6 June) volumes are now 1.1% lower, year-on-year, whilst calendar year to date (January to May) is 4.7% ahead.  This could mean the sector missing out on growing demand in the short-term. 

Global milk production averaged 849.5 million litres per day in May, an increase of an estimated 16 million litres per day (+1.9%) across the selected regions, compared to the same period in the previous year. All regions, with the exception of the UK, recorded an increase.

US rose by 2.5% in May driven by herd size, disease recovery and a boost to cheese production facilities, and NZ by 3.6%. Australia grew by 5.4%.  Argentina also grew by 2.0%.    

Milk deliveries in the EU averaged an estimated 428 million litres per day in May, an increase of 6.3 million litres per day (+1.5%). we saw the greatest year on year volume increase from Germany, up 172 million litres (+6.2%) for the month of May, followed by Poland and the Netherlands, up by 45 million litres (3.8%) and 42 million litres (+3.6%), respectively.

According to Rabobank, milk production growth among the 'Big 7' exporters is forecast to slow to 1.0% in 2026, down from 3.1% in 2025, with the sharpest contractions being driven by the EU and coming in Q4 ’26 and Q1 ’27.


Wholesale markets

Q2 brought fresh challenges for the markets after what was quite a promising Q1.  In the end the volumes of milk in the market and levels of butter and other commodities in stock weighed too heavily on markets. 

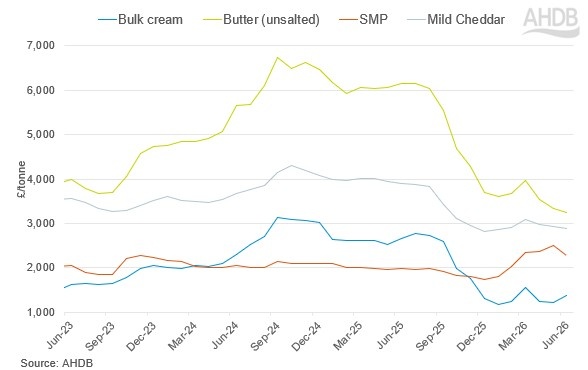
  • In June, the cream price saw some positive shifts in response to lower milk volumes with less pressure on processing capacity and lifted to £1,387/t.
  • Butter lost another £90/t to fall to £3,240 the lowest level since July 2021
  • Mild cheddar prices most a further £50/t to £2,890/t
  • SMP corrected downwards, with the wider protein complex, falling to £2,290/t

However, markets in July started to see some recovery in response to heat-driven supply challenges and will currently be above quoted values. 

The GDT auction though fell by 4.9% in the latest period showing that the supply-side fundamentals are still in play.     

Figure 1. UK dairy product wholesale prices

  Line graph showing UK dairy wholesale prices

Figure 1 shows average UK wholesale prices from early 2023 to June 2026, measured in pounds per tonne.

Butter prices remain consistently higher than the other products throughout the period. All four products show a steep decline from late summer 2025 into early 2026, followed by modest recovery in February and March 2026. All products fell apart from cream in Q2.

As of June, milk market values (which is a general estimate on market returns and the current market value of milk based on UK wholesale price movements and typical milk utilisation) fell to 33.6ppl. AMPE fell by 7% to 35.5ppl, MCVE fell by 2% to 33.8ppl.  A movement in the MMV is generally predictive of a move in farmgate milk prices three months later.

Farmgate milk prices

The latest published farmgate price was for May and was 34.20ppl, down 0.15 pence (0.4%) on the previous month's price of 34.35ppl. Latest announced farmgate prices were steady to firm for some with some processors moving upwards but also several holds.

Retail aligned liquid contracts remained steady to firm with the exception of Sainsbury’s, which made a price reduction of 0.13ppl, counteracting the positive movement seen in June. Muller Co-op Dairy Group and Tesco made no change to their price. M&S and Waitrose made a positive announcement of 1.35ppl and 1.00ppl respectively.

On non-aligned liquid contracts, all buyers on the AHDB League table held their price.

Crediton Dairy held for the fifth consecutive month. Payne’s Dairies held on to their price after seeing a decline in March. Muller’s price has been stable since April. Pembrokeshire Creamery held on to their price after making a positive announcement in June.

Cheese contracts held steady to firm. Barbers and Wyke Farms are holding steady after making a positive announcement in June.

Saputo made a positive announcement for another consecutive month increasing their price by 1.75ppl. First Milk Manufacturing and Belton Cheese increased their price by 0.6ppl and 1.5ppl after holding steady in June.

Leprino and South Caernarfon held on to their price while Wensleydale Creamery made a positive announcement of 0.65ppl.

Manufacturing contracts saw growth.

Meadow increased their price by 1.00ppl after holding steady for four months. Pattemores Dairy increased their price by 1.00ppl for another consecutive month. UK Arla Farmers Manufacturing increased their price by 1.41ppl after holding steady in June.

Input costs

API data for March shows total agricultural input price inflation rose by 3.7% year-on-year and was up 1.1% month-on-month, primarily driven by fertiliser, soil enhancers, fuels and lubricants.

The conflict affected the Strait of Hormuz, through which around one-fifth of oil and a large share of fertiliser trade passes. Disruption and perceived risk in this region led to sharp increases in oil and gas prices. In March, crude oil prices climbed to around $110 per barrel, while gas prices rose significantly due to strikes and supply uncertainty. Because natural gas accounts for roughly 60% of fertiliser production costs, this directly led higher fertiliser prices. Diesel and oil costs also rose as a result of the geopolitical risk, with the API reporting the energy and lubricants index value up 10.9% month-on-month.

Suggestions to negate the impact of price rises include monitoring input prices such as fertiliser using the AHDB GB fertiliser prices and making the most of alternatives such as FYM or digestate. However, it remains difficult for farmers to negate the impacts of these input price rises, as divergence between input and output prices continue to increase.

Demand

During the 12 weeks ending 13 June 2026, cows’ dairy continued to be in volume growth, increasing by 0.2% year-on-year¹. Spend on cows’ dairy increased by 3.4% year-on-year, driven by a 3.2% increase in average prices paid despite farmgate prices and the majority of wholesale prices continuing to decrease.

Cows' milk

Milk volumes declined by 0.9% year-on-year¹. Average prices increased by 5.6%, and as a result spend saw a 4.6% increase.

Declines were seen for semi-skimmed, skimmed, and plant-based milk. Whole milk continued to see volume growth, with a 1.7% increase year-on-year. Other cow milk was in growth this period, with volumes up 15.9%, driven mainly by higher purchase volumes per shop.

Cows' cheese

Cheese continued to deliver strong volume growth, with demand increasing by 2.3% year-on-year.¹ Increased promotional activity helped lower average prices by 0.7%, encouraging shoppers to buy an additional 2.6 million kg on deal.

The rise in volumes also supported value growth, with spend increasing by 1.6% over the period.

Other cows’ cheese (+12.0%), snacking (+5.3%) and speciality and continental (+2.5%) drove overall cows’ cheese performance. Cottage cheese (+1.7m kg) continued to be the key driver for other cow cheese performance, while kids snacking (+0.5m kg) drove the snacking category.

Within speciality and continental cheese, grated mozzarella was particularly important, with an additional 0.5m kg purchased year-on-year.

Cheddar, which represents a majority (43.9%) of all cow cheese volumes continued to see decline with a 1.0% decrease, primarily due to a reduction in volumes of mild block, grated and sliced Cheddar purchased.

Despite higher price points, extra mature, mature and vintage Cheddars all saw growth.

Cows' butter

Butter saw a 1.0% decrease in volumes purchased year-on-year¹. Spend saw a 3.7% decrease, mainly driven by average price reductions of 2.8% year-on-year, with decreases in wholesale price feeding through to shoppers, as we predicted back in December.

Block butter continues to be the only subcategory to see volume growth (+4.9%). However, this growth was not enough to offset the decline in butter spread volumes (-3.7%).

Cows’ yogurt, yogurt drinks and fromage frais

Yogurt, yogurt drinks and fromage frais continued to see growth, with volumes up 6.6% year-on-year. Average prices also increased, up by 2.4%, and as a result spend increased 9.2% year-on-year¹. 

Almost all subcategories saw growth, with kids’ yogurts year-on-year growth increasing for the first time since January 2026, and standard flavoured seeing positive year-on-year growth for the first time since December 2024, aided by an increase in promotional activities in the latest period.

Cows' cream

Cream volumes saw a 2.8% decrease year-on-year¹. Average prices increased by 3.5%, and as a result spend increased by 0.6%.

Whipping cream was the only subcategory in cream to see volume growth, with an additional 7k L (+3.2%) purchased year-on-year.

Aerosol continued to record the largest actual volume decline (163k L). While higher levels of promotional activity was seen compared to previous years, the decrease in volumes may reflect shifting consumer preference towards less processed foods.

See the full data and these insights visualised on our GB household dairy purchases retail dashboard.

¹ NIQ Homescan POD, Total GB, 12 w/e 13 June 2026


Trade

UK dairy export volumes in Q1 2025 grew by 2% in Q4 2025 to 326,000 tonnes with value falling by 7% to £478 million due to falling commodity prices. UK dairy exports continued to rise for the fourth quarter in a row. Shipments to EU countries declined by 1,400 tonnes whilst non-EU exports grew by 9.000 tonnes.

The overall increase was largely driven by an increase in the exports of powders, yogurt, butter and cheese. A decline in the exports of milk and cream by 17,800 tonnes (8.8%) and whey by 2,500 tonnes (13.5%) during the period limited overall upside movement. Though overall exports increased in terms of quantity, there was a fall in value terms for all commodities due to lower prices except for powders and yogurt. The data covers the period until March 2026, therefore does not fully capture the impact on export volumes resulting from the war in the Middle East. It is anticipated that there will be an impact on exports to the Middle East and Asia in Q2 and beyond.

AHDB have undertaken a detailed analysis of our export prospects into the MENA and other markets as part of this study: Prospects for UK agri-food exports | AHDB


Image of staff member Susie Stannard

Susie Stannard

Lead Analyst (Dairy)

See full bio


Sign up to receive the latest information from AHDB.

While AHDB seeks to ensure that the information contained on this webpage is accurate at the time of publication, no warranty is given in respect of the information and data provided. You are responsible for how you use the information. To the maximum extent permitted by law, AHDB accepts no liability for loss, damage or injury howsoever caused or suffered (including that caused by negligence) directly or indirectly in relation to the information or data provided in this publication.

All intellectual property rights in the information and data on this webpage belong to or are licensed by AHDB. You are authorised to use such information for your internal business purposes only and you must not provide this information to any other third parties, including further publication of the information, or for commercial gain in any way whatsoever without the prior written permission of AHDB for each third party disclosure, publication or commercial arrangement. For more information, please see our Terms of Use and Privacy Notice or contact the Director of Corporate Affairs at info@ahdb.org.uk  © Agriculture and Horticulture Development Board. All rights reserved. 

×