Out of home consumption facing cost-of-living challenge
Thursday, 16 March 2023
By the end of 2022, the value of the out-of-home market had reached pre-pandemic levels. However, this was driven by high levels of inflation, and volumes are still lower than in 2019. Demand will be further challenged by the cost-of-living in 2023 as consumers dine out less frequently and trade down.
Just under half (47%) of consumers plan to eat out less in the coming months, according to data from Two Ears One Mouth (Feb 2023). This will result in continual trade down – from a dining out experience, to takeaway, to food-to-go, and to eating in-home. There is already evidence of more convenience dishes consumed in-home, some in place of an out-of-home meal.
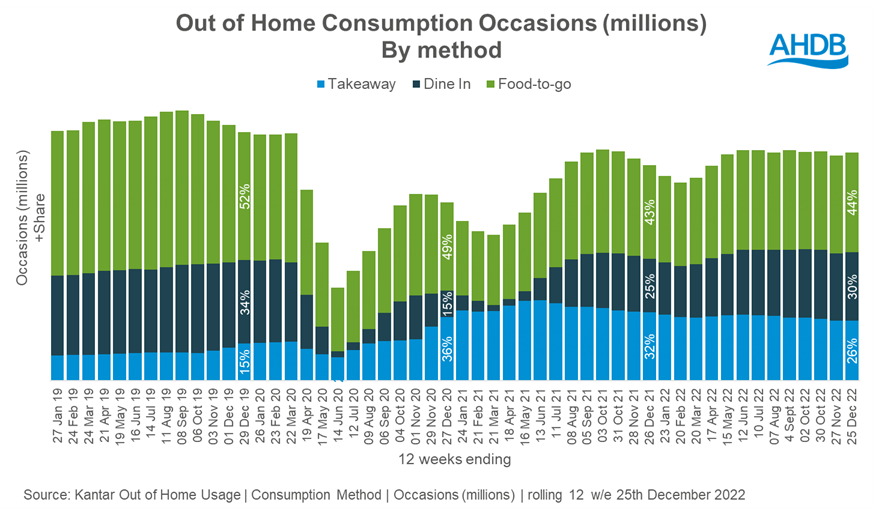
Dining-in had started to make a good recovery in 2022, and by the end of the year was taking a bigger share of out-of-home occasions than takeaways.

Takeaways
In 2022, consumers spent £17bn on takeaways. There was a year-on-year decline, of -13%, as people consumed takeaways less often, linked to them being able to dine-out more than in 2021.
Collected and drive-thru orders still account for the majority (74%) of takeaways (Kantar OOH, 12 w/e 25 Dec 2022). However, an area that has been making ground is orders made directly from restaurants’ own websites/apps, accounting for a bigger share (13%) of orders than those made via the aggregators such as Deliveroo.
Pizza just about retains its leading position as the most popular dish type, accounting for 13% of takeaway spend (Kantar OOH, 52 w/e 25 Dec 2022). Another area that has made significant share gains in takeaways is sandwiches (including standard sandwiches, hot wraps, subs, etc), which accounted for 12% of takeaway spend.
This is important for pork performance in the out-of-home market as 43% of sandwiches are pork-based. Pork has lost ground to chicken, which accounted for 31% of sandwiches in 2022, up three percentage points year-on-year, highlighting the need for continued innovation for pork to remain relevant in this area.
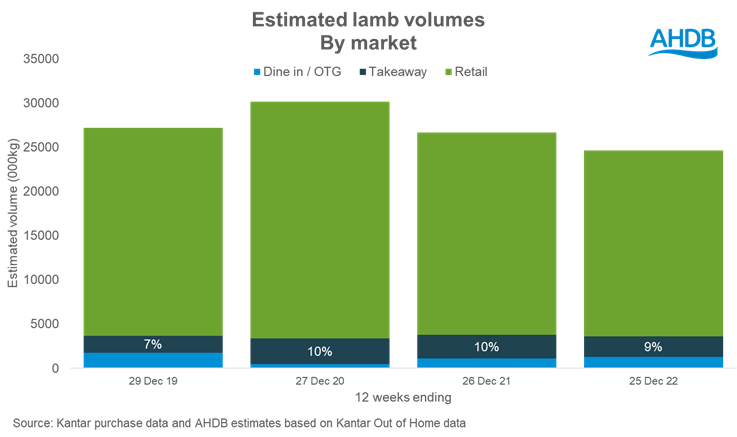
Takeaways are also key to lamb performance, as they accounted for 9% of the total estimated lamb consumption in the final 12 weeks of 2022 (AHDB estimates based on Kantar data, 12 w/e 25 Dec 2022). This is far higher than the 5% share for beef and 4% for pork. A decline in Indian takeaways and kebabs means that lamb volumes have eased. There is a need for a more diverse range of lamb dishes, including in less traditional, but growing cuisines, such as Mexican.

Non-takeaways
Non-takeaways includes both dine-in and food-to-go (FTG)
Dine-in
Dine-in accounted for 30% of OOH consumption occasions in the 12 w/e 25 Dec 2022 (Kantar OOH). It has been gaining share since the pandemic caused a contraction in this market, linked to restrictions and general consumer concern. This share is now not far behind its pre-pandemic level of 34% (Kantar, 12 w/e 29 Dec 19).
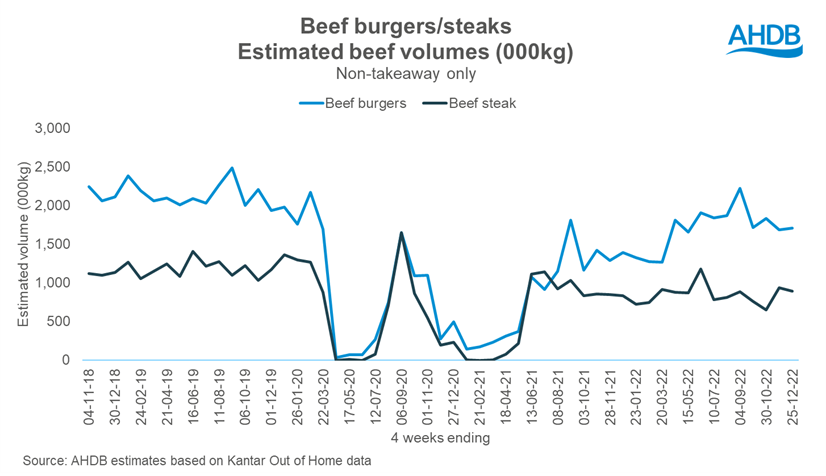
The dine-out market will increasingly be about treat and experience; while people will dine out less often, they are likely to spend more when they do. Beef burgers and steaks should remain key to these treat occasion types. However, AHDB volume estimates suggest that these dishes are back up to pre-pandemic levels. This is partly linked to the market backdrop but shows the need for continued menu presence and quality provision in this area.

Many items, red meat included, will be challenged by the legislation for calorie information on menus, with 59% noticing this when eating out or ordering food (AHDB/YouGov Consumer Tracker, Nov 2022). In addition to this, health is the top reason for taking part in Veganuary. Therefore, balancing this with other positive health information could be beneficial, such as showcasing red meat as high in protein, or a good source of vitamin B12.
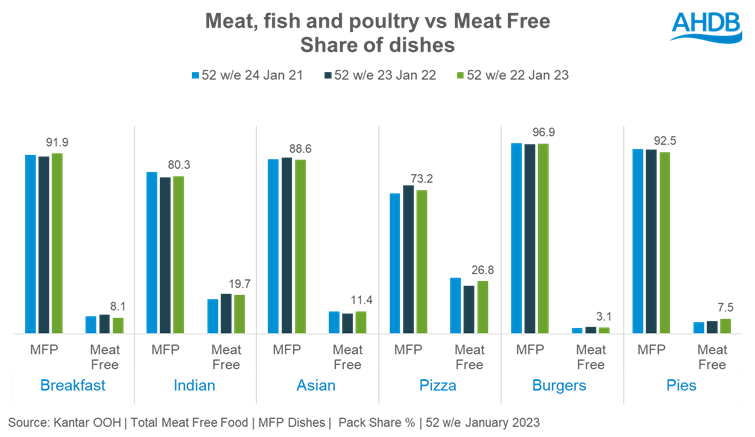
Despite these challenges, meat remains a firm favourite, and the Kantar OOH data shows that for every one meat-free burger consumed out of home, 16 meat/poultry burgers are consumed. Pizza is one area where meat-free takes a higher share, while meat-free pies are on the rise, albeit still small compared to MFP.

Food-to-go
Food-to-go (FTG) is experiencing a slowdown as frequency of purchase declines, as is how much people spend on each purchase. This is a key area where consumers may choose to save money, opting for homemade items (e.g., sandwiches) over a FTG purchase. Loyalty schemes, meal deals, and promotions will be key here, with 56% of FTG shoppers saying they are always on the lookout for a meal deal when they consider buying FTG (IGD ShopperVista, Q4 2022).
FTG is a key area of importance for pork, with sandwiches and pastries/sausage rolls being an important part of pork out-of-home consumption, respectively accounting for 46% and 12% of non-takeaway pork consumption in 2022. Meal deals incorporating hot items like bacon sandwiches and sausage rolls will continue to hold relevance, particularly given that 42% of FTG customers want to see a larger hot food range (IGD ShopperVista, Q4 2022).
In summary, all areas of the OOH market will be challenged by inflation. Consumers will buy food out of home less often in order to save money, while operators have seen their margins being squeezed by input costs. Beef, lamb, and pork will remain key to future recovery as consumers seek an element of comfort and familiarity amidst economic uncertainty.
Sign up to receive the latest information from AHDB
While AHDB seeks to ensure that the information contained on this webpage is accurate at the time of publication, no warranty is given in respect of the information and data provided. You are responsible for how you use the information. To the maximum extent permitted by law, AHDB accepts no liability for loss, damage or injury howsoever caused or suffered (including that caused by negligence) directly or indirectly in relation to the information or data provided in this publication.
All intellectual property rights in the information and data on this webpage belong to or are licensed by AHDB. You are authorised to use such information for your internal business purposes only and you must not provide this information to any other third parties, including further publication of the information, or for commercial gain in any way whatsoever without the prior written permission of AHDB for each third party disclosure, publication or commercial arrangement. For more information, please see our Terms of Use and Privacy Notice or contact the Director of Corporate Affairs at info@ahdb.org.uk © Agriculture and Horticulture Development Board. All rights reserved.
Topics:
Sectors:
Tags:

