Deceleration of meat and dairy alternative growth this Veganuary
Friday, 25 February 2022
While January unsurprisingly saw a rise in retail sales of meat alternatives, the sector’s growth has begun to decelerate, with market share remaining small this Veganuary.
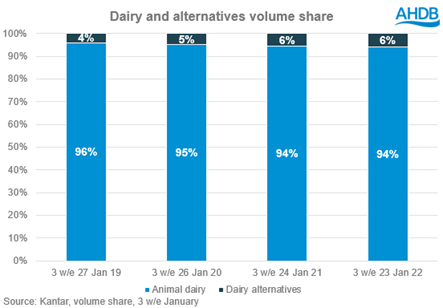
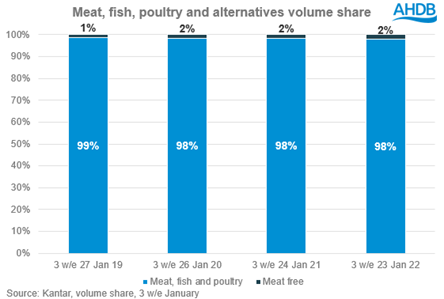
While retail volumes of meat-free products* were up 15% compared to last Veganuary, the growth was from a low base and was not enough to significantly impact meat-free’s market share, remaining at 2% for the last three years. Meanwhile, dairy alternatives declined by 5% (Kantar, 3 weeks ending 23 January 2022), leaving its share of the market fixed at 6% since 2021.


Meat, fish and poultry (MFP) volume sales remain elevated on pre-pandemic levels, up 2.0% on the first three weeks of January 2020, while animal dairy was up 4.2%. A return to the eating-out market led to a decline in meat and dairy retail volumes year-on-year, however both enjoyed a modest uplift compared to the average week in 2021. The ‘post-Christmas’ shop is an important one for meat and dairy, as shoppers stock up for the new year after bank holiday closures. The week ending the 9 January was bigger for MFP volumes than the first two weeks in December (w/e 5 December and w/e 12 December) and the first full week in January was bigger for dairy volumes than every week in December. Reminding shoppers of the health benefits of meat and dairy could help get consumers off to a healthier start to the year.
The growth of meat alternatives in retail could have been predicted, as many retailers launched new products and ranges, with attractive deals during January as well as greater prominence and larger shelf space. Compared to the average week in 2021, meat-free retail volumes increased by more than 50%, while dairy alternatives see a more modest 15% uplift. This could be due to retailers focusing more on meat-free promotions or that for many people, Veganuary is about switching from meat rather than cutting out all animal-based products.
Overall, the number of households buying alternatives remains low, with only 9% of households buying meat-free products weekly during January, compared to 87% buying meat. There is a similar story for dairy with animal dairy products bought weekly by 95% of households in January, while only 17% bought a dairy alternative. And while the number of households buying meat-free drops to around 6% for the remainder of the year, dairy alternatives remain more stable throughout the year. The research also suggests that alternative products may not always come at the cost of meat sales. According to Kantar, in January 2021, 62% of shopping baskets containing meat-free also contained a meat product, showing that either shoppers incorporated meat alternatives into their repertoire or had varied diets within their home.
During the next year, there is a likelihood that consumers will become more price sensitive as we see inflation hit shoppers’ budgets. This could benefit meat and dairy as they tend to be cheaper than alternatives. For example, in 2021, the average price of cow’s milk was £0.61 per litre but alternative milks were on average twice as much at £1.21 per litre (Kantar, 52 w/e 26 December 2021). Shoppers are also less likely to risk trying new products when money is tight and after the 2008 financial crash, we saw shoppers returning to more traditional meals.
Opportunities for meat and dairy
- Remind shoppers of the health benefits of meat and dairy during January to make the most of the big post-Christmas shop.
- Over 95% of households buy meat or dairy weekly in January showing it is still eaten by the lions-share of the population. Retailers can cater to these shoppers through innovation and inspiration at point of purchase. See our research of how to inspire shoppers in the meat aisle.
- With the economic outlook, shoppers may be more wary of new products and return to tried and trusted meat cuts and favourite dairy products.
* Meat-free definition defined by AHDB (includes meat alternatives and selected vegetarian/vegan ranges. Excludes pizzas).
Sign up to receive the latest information from AHDB
While AHDB seeks to ensure that the information contained on this webpage is accurate at the time of publication, no warranty is given in respect of the information and data provided. You are responsible for how you use the information. To the maximum extent permitted by law, AHDB accepts no liability for loss, damage or injury howsoever caused or suffered (including that caused by negligence) directly or indirectly in relation to the information or data provided in this publication.
All intellectual property rights in the information and data on this webpage belong to or are licensed by AHDB. You are authorised to use such information for your internal business purposes only and you must not provide this information to any other third parties, including further publication of the information, or for commercial gain in any way whatsoever without the prior written permission of AHDB for each third party disclosure, publication or commercial arrangement. For more information, please see our Terms of Use and Privacy Notice or contact the Director of Corporate Affairs at info@ahdb.org.uk © Agriculture and Horticulture Development Board. All rights reserved.
Topics:
Sectors:
Tags:


