USA Dairy Market: improved margins boost milk supplies
Thursday, 6 March 2025
Key points
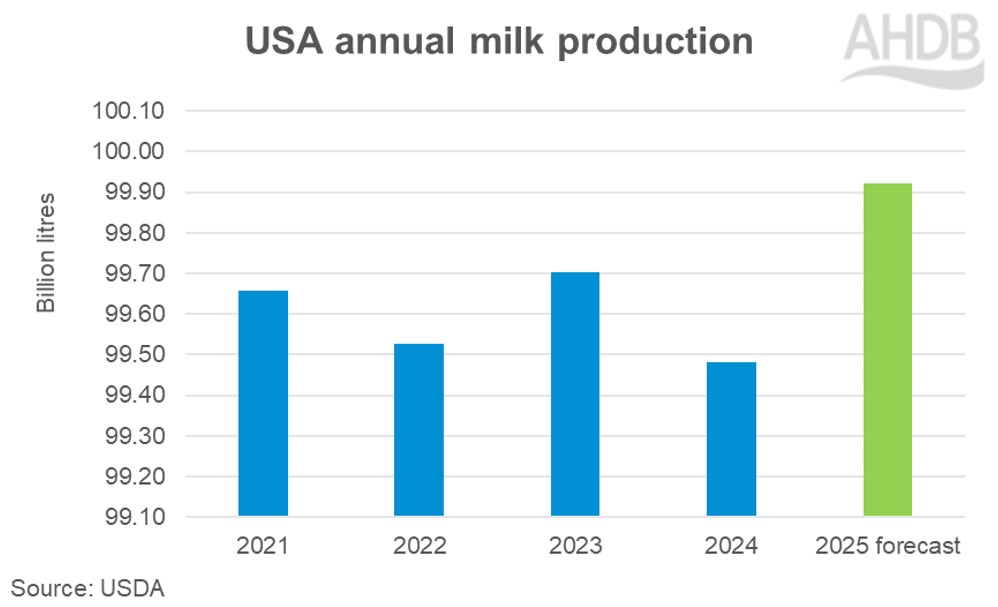
- US milk production is forecast to grow 0.4% year-on-year in 2025
- Good demand in the domestic and export market is boosting prices
- US total dairy exports increased 2.7% in 2024, year-on-year
- Recently announced Trump tariffs create uncertain trade flows
Supply
According to the latest USDA report (February 2025), estimated milk production for the United States (US) in 2024 was 99.5 billion litres. In 2025, it is forecast to grow by 0.4% to 100.0 billion litres, after a decline in 2024.This will be primarily driven by an increase in the number of milk cows and improved margins. The number of milk cows in the national herd is expected to increase to 9.38 million head in 2025, an increase of 0.4% compared to the previous year. According to Rabobank milk per cow edged up by 0.2% year-on-year in October 2024, which is the fourth consecutive month of year-on-year growth. However, the figures are comparable to weaker figures in the previous year.
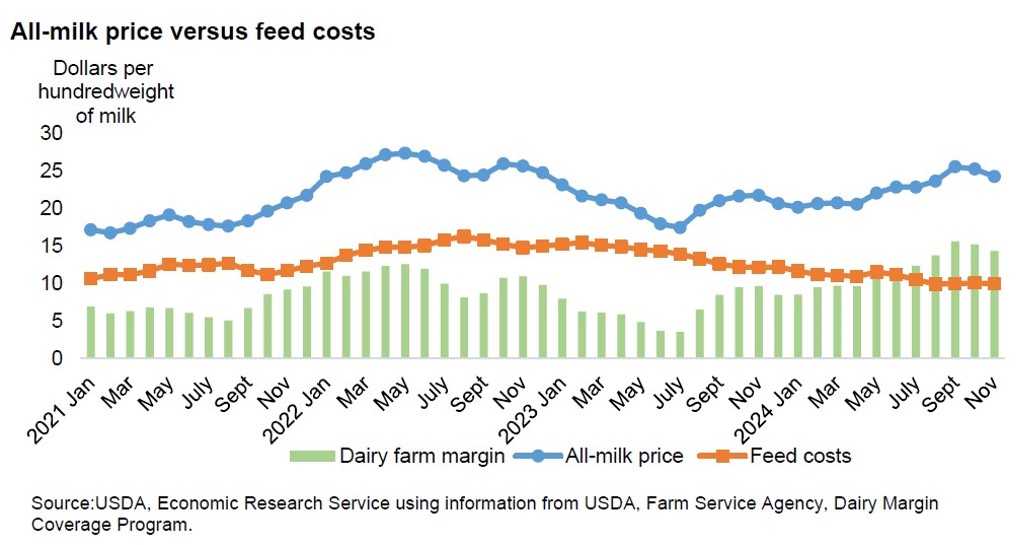
Improved margins following higher milk prices and lower feed costs have incentivised farmers to increase milk output. However, the impact of avian influenza on milk volumes across states, and low dairy heifer inventories are still a challenge for the sector. 28 states in the country are registered in the National Milk testing strategy, which represents 65% of total milk production. The state of California is badly affected and going forward the situation I has to be closely monitored.
Lower feed costs and higher milk prices remain favourable for increasing milk deliveries in the coming months.
Prices
The all-milk price has been increasing steadily from the middle of 2023 until November 24 with minor dips in between. Overall, the trend is firm with the all-milk price expected to grow by around 22% between 2021-2025 at $22.60 per hundredweight (cwt). In contrast, feed prices have been declining during the period. Robust pricing coupled with lower feed costs have resulted in healthier margins for producers.
Growing milk production and expected higher output of the fat component will drive increasing dairy product production in 2025. Prices are expected to remain firm following consumers preference for protein rich dairy products.
Trade
Exports
US dairy products are competitive on the global market due to lower feed costs and reduced shipping costs in comparison to the EU27 and UK.
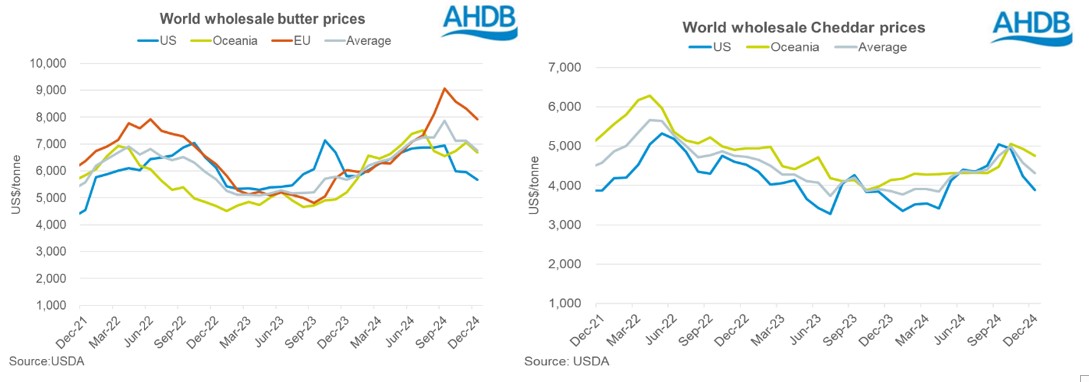
Looking at world wholesale prices, US butter and cheese prices have been declining from September 2024. More competitive pricing has favoured export demand for US product in the market.
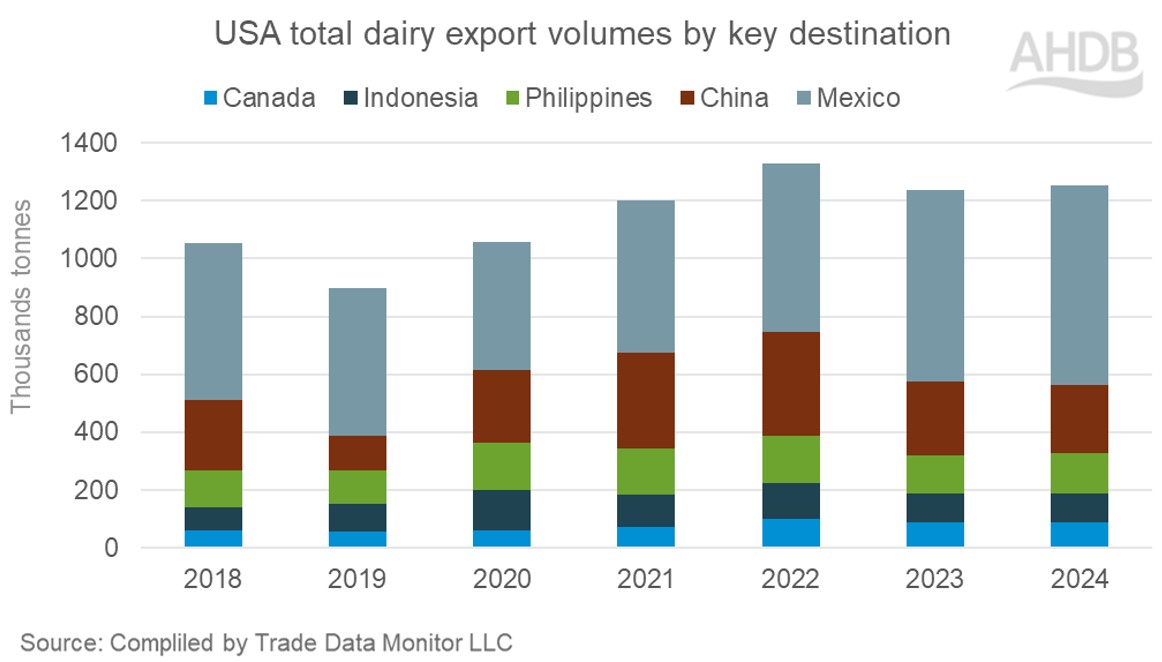
In the year 2024, US dairy exports totalled 1.96 million tonnes, an increase of 2.7% year-on-year. Milk and cream dominated exports, followed by whey, and cheese and curd. Butter, yogurt, and cheese exports picked up significantly in 2024 year-on-year. Cheese is the shining star in the basket with exports recording the highest increase in tonnage. Good supplies paired with competitive pricing has resulted in increases in volumes shipped to most of the key destinations except for China, Canada and some Asian countries.
Mexico is the dominant destination for the USA dairy exports, with a 35% market share of volume. Volumes shipped to Mexico have continued to strengthen year-on-year from 2020 onwards, picking up by 29,900 tonnes in 2024. Meanwhile shipments to South Korea, Japan and Philippines have also seen growth of 14,000 tonnes, 10,600 tonnes and 7,400 tonnes respectively.
However, the tariffs announced by the newly elected Trump government for Mexico, China and Canada could cause some friction and impact US dairy exports. Tariffs are also possible for EU and UK, which will remain a key watch point going forward should retaliatory measures be taken.
Imports
In 2024, total dairy imports were reported at 505,000 tonnes, a remarkable increase of 21.2% year-on-year. Cheese and curd and butter were the major dairy products to be imported. Good demand in the domestic market propelled the upwards trend.
The EU27 remained the most significant provider of dairy products to the USA, holding a 47.5% market share. Imports from New Zealand, Canada and Mexico have increased by 18,700 tonnes, 8,500 tonnes and 7,400 tonnes respectively. The UK holds a meagre 2.0% share in the total imports to the US, which amounted to 9,900 tonnes in 2024, although tends to focus on higher value products. The UK mainly exports cheese and curd, which constitutes more than 97% of its total exports to the USA. 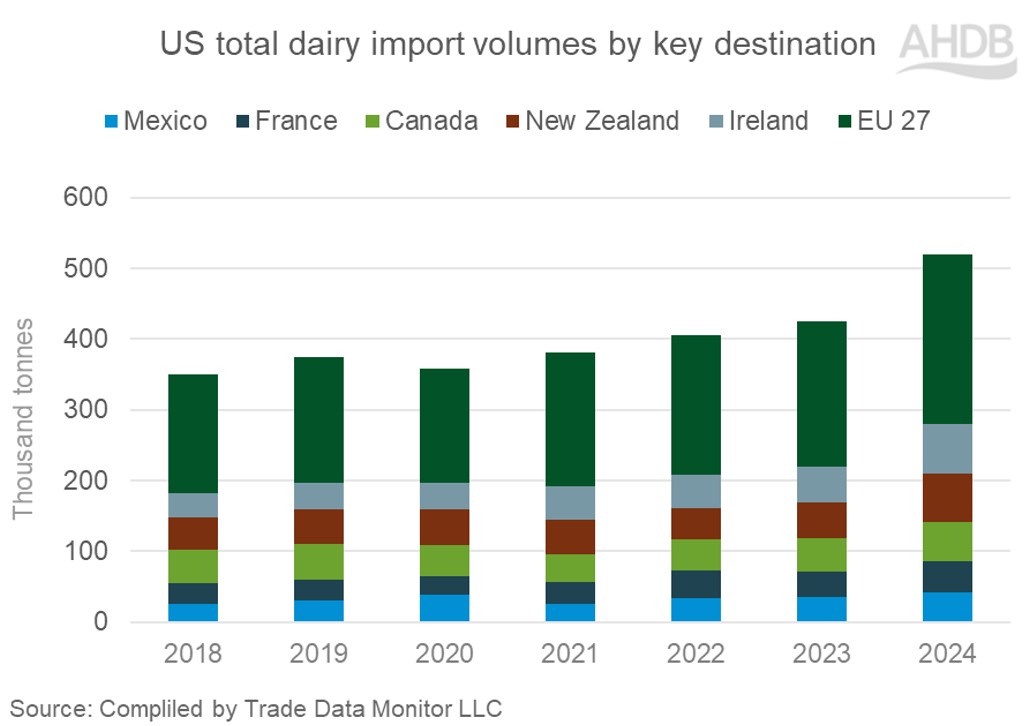
While the first round of US tariffs did not trigger retaliation from Beijing, China has now announced an additional 10-15% tariff on various US agricultural products set to take effect on March 10. All dairy products are included in the scope (10% tariffs), except for whey products under HS code 040410 and lactose, which are the main products imported from the US.
According to the latest Rabobank report, milk production is likely to continue growing by 0.9% year-on-year in 2025. This in turn will increase availability of dairy products in the markets. Domestic demand is likely to keep pace with consumers increasing preference for processed healthy dairy products. Any cuts in the Supplemental Nutrition Assistance Program funding, which provides monthly funds to buy groceries, could affect the sales of liquid milk, cheese and yogurt. Trade flows in the global market will depend on the impact of Trump tariffs. The UK exports mainly cheese to the US and with consumers growing preference, there remains ample opportunities for our cheese makers catering to speciality British cheese providing tariffs are not put in place.

Sign up to receive the latest information from AHDB.
While AHDB seeks to ensure that the information contained on this webpage is accurate at the time of publication, no warranty is given in respect of the information and data provided. You are responsible for how you use the information. To the maximum extent permitted by law, AHDB accepts no liability for loss, damage or injury howsoever caused or suffered (including that caused by negligence) directly or indirectly in relation to the information or data provided in this publication.
All intellectual property rights in the information and data on this webpage belong to or are licensed by AHDB. You are authorised to use such information for your internal business purposes only and you must not provide this information to any other third parties, including further publication of the information, or for commercial gain in any way whatsoever without the prior written permission of AHDB for each third party disclosure, publication or commercial arrangement. For more information, please see our Terms of Use and Privacy Notice or contact the Director of Corporate Affairs at info@ahdb.org.uk © Agriculture and Horticulture Development Board. All rights reserved.

