How much money are UK consumers spending on food since the cost-of-living crisis?
Tuesday, 18 July 2023
Back in 2020, we reported that the average UK household spends 8% of outgoings on food consumed in the home (USDA).
This was at a time when household incomes were rising, and therefore the proportion spent on food was falling, even though overall demand wasn’t changing. Fast forward to today, rising inflation has caused increasing pressure on all household finances, with the average household disposable income dropping 0.6% in 2022, while inflation was 7.9% (ONS May 2023). We would therefore expect the proportion of household income being spent on food to have increased - is this the case?
How much do we now spend on food?
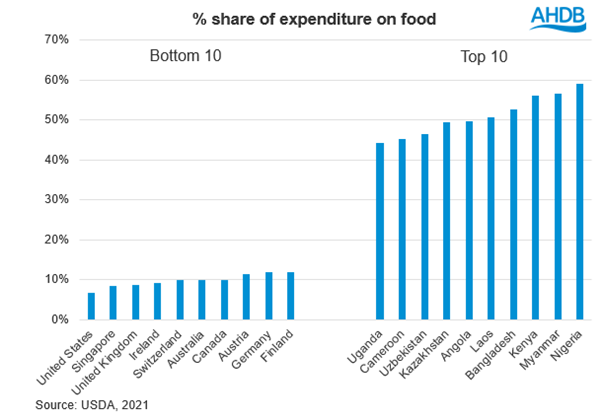
According to the USDA, food share has increased slightly and in 2021 UK consumers spent 8.7% of their income on food. This shows the proportion of spend on food was rising before the cost-of-living crisis took hold. Food expenditure only includes food bought for consumption at home. Out-of-home food purchases, alcohol, and tobacco are not included.
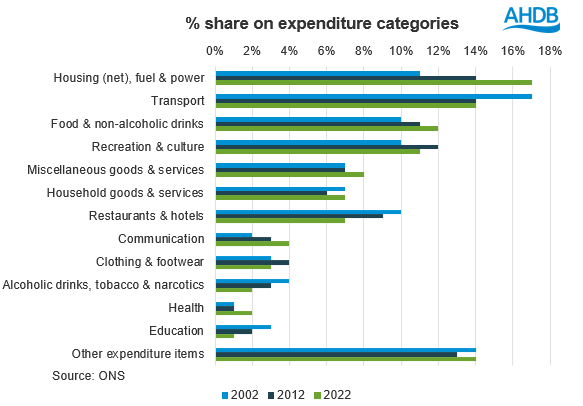
Recently released data from the Office of National Statistics for the financial year ending 2022 estimates we spend 11.8% of our total expenditure on food and non-alcoholic drinks. Food is now the third biggest expense for households as shoppers scale back their spend on recreation and culture. If shoppers were continuing to buy the same volume of food, this share could have increased even more, however instead we have seen shoppers reducing the volumes they purchase in an attempt to balance rising prices.
While many farmers may wish for consumers to spend more on food and drink, with the pressures of other areas such as housing and heating, shoppers are already having to reduce the proportion of income they spend on recreation, hotels and clothing. Food and drink is one of the more resilient categories because it is an essential.

In the financial year ending 2022 we spent an average of £62.20 per household per week on food. This is an increase of just under 50% since 2001. In comparison, total spend has only increased by 33%, so food is taking up more of shopper’s expenditure. Although this is nowhere near the increases we have seen in other areas, with spend on housing, communication and health more than doubling in the last 20 years.
The real ramp up of inflation happened in the most recent financial year. Kantar have more up to date food expenditure figures and their data shows shoppers spent an average of £63.04 per household per week for the financial year ending 2022 but for 2023, this has risen by 7% to £67.15. In the most recent 12 weeks, households have spent an average of £70.52 per week on food (average week during 12 w/e 16 April 2023). With the ONS suggesting household income is likely to have decreased over this time, we expect next year households will have to spend even more of their income on food.
The US, Singapore and Ireland are the only countries where consumers spend less of their income on food than the UK according to 2021 data from the USDA.

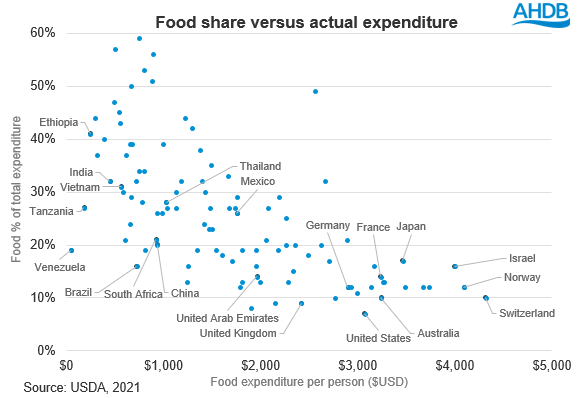
Overall, when looking at spend per person, the UK is one of the biggest spenders. However, this is less than other similar countries such as Germany, France, United States and Canada. The Swiss spend the most on food at $4,313 per person in 2021 closely followed by Norway and Israel. This is nearly 80% more than the UK at $2,418. The countries which spend the least per person on food are Venezuela, Tanzania and Ethiopia.

Further details on how British consumers are adapting and changing their shopping habits due to rising inflation can be found on our retail and consumer insight homepage.

Sign up to receive the latest information from AHDB
While AHDB seeks to ensure that the information contained on this webpage is accurate at the time of publication, no warranty is given in respect of the information and data provided. You are responsible for how you use the information. To the maximum extent permitted by law, AHDB accepts no liability for loss, damage or injury howsoever caused or suffered (including that caused by negligence) directly or indirectly in relation to the information or data provided in this publication.
All intellectual property rights in the information and data on this webpage belong to or are licensed by AHDB. You are authorised to use such information for your internal business purposes only and you must not provide this information to any other third parties, including further publication of the information, or for commercial gain in any way whatsoever without the prior written permission of AHDB for each third party disclosure, publication or commercial arrangement. For more information, please see our Terms of Use and Privacy Notice or contact the Director of Corporate Affairs at info@ahdb.org.uk © Agriculture and Horticulture Development Board. All rights reserved.
Topics:
Sectors:

