Why UK consumers spend 8% of their money on food
Monday, 3 February 2020
This is an old article - for the most recent analysis please see our article on how much money are UK consumers spending on food since the cost-of-living crisis.
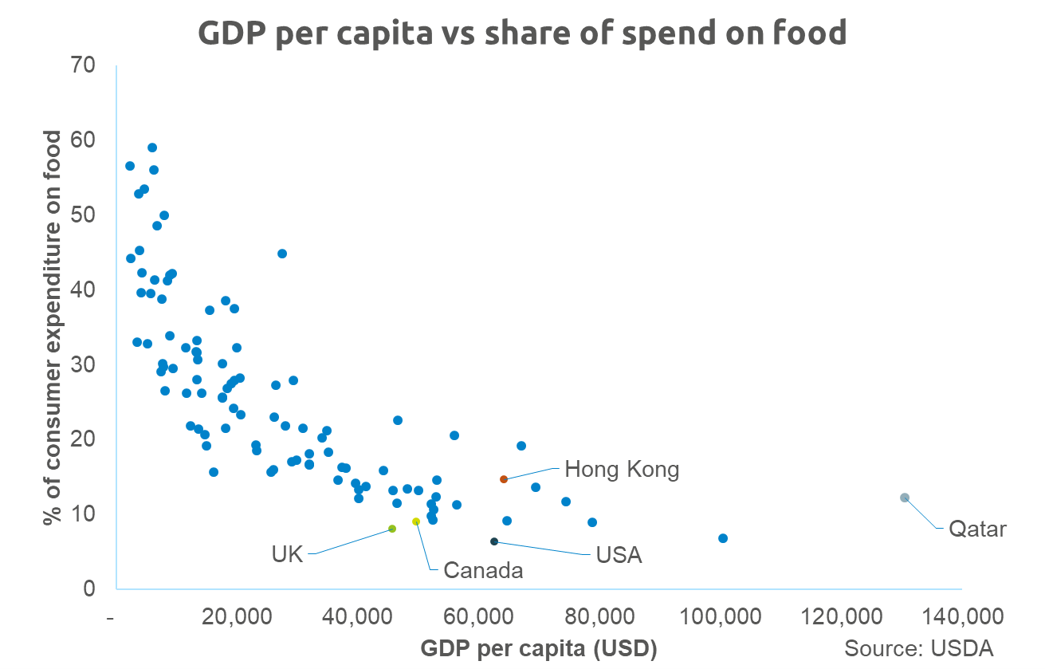
The average UK household spends 8% of its outgoings on food consumed in the home. Contrast this to India, where 30% of household spending goes on food, or Nigeria where it’s 59%. Why are we so different?
Simply put, as incomes rise, the proportion of income spent on food falls. This is a well-established relationship known as Engel’s Law and happens because our demand for food is, to a certain extent, ‘non-expandable’. We may trade up and buy more high-value foods like meat but, in volume terms, our demand doesn’t change. In other words, we can only eat so much! Other types of spending are expandable – as we get richer we tend take more holidays and increase spending on other leisure pursuits. Compared to other countries of a similar GDP per capita (a good proxy for wealth), our share of spend on food is not particularly abnormal.

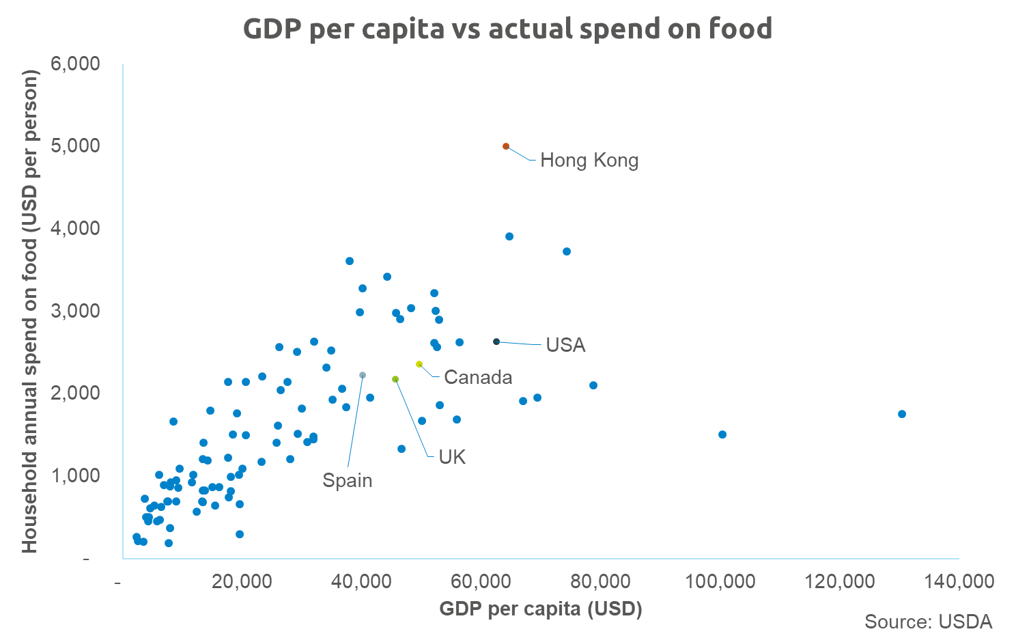
Over the course of time, despite short term volatility, the price of many food commodities has fallen. This is for a number of reasons including technological advances in farming and increases in global trade which allows more flexibility of supply. However, in absolute terms, the UK spends a fairly high amount on food - £41.70 a week per person, according to the USDA, comparable to other high income countries like Spain or Canada.

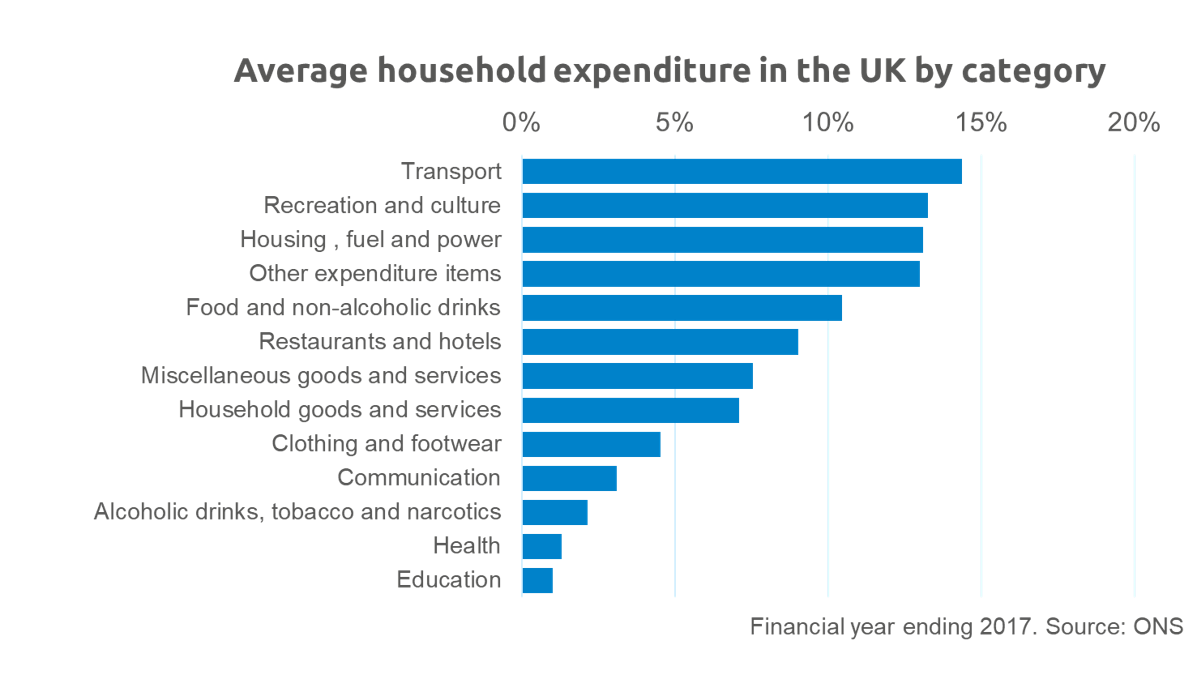
According to the Office of National Statistics, between 1957 and 2017 the share of household expenditure spent on food has halved. This partly reflects our larger incomes, smaller households and a greater choice of products at different price points. Over the same period, the share of our spending going on housing has doubled and spending on transport has also significantly increased. There is significant variation between age groups - households where the head is aged under 30 spend 24% of their outgoings on housing, fuel and power while the over 75s spend only 14%.
For many low-income families in the UK, food poverty is a pressing issue and putting sufficient nutritious food on the table is a struggle. The Eatwell Guide is Public Health England’s official guidance on a diet that meets standard nutrient requirements. Analysis by the Food Foundation showed that the poorest 50% of households who wanted to eat a diet following Eatwell guidelines would need to spend almost 30% of their disposable income on food. The lowest 10% of households by income would need to spend almost 75%.

Most farmers and growers would like the UK consumer to spend more on British food but, for many families, food is just one of a number of competing needs that they must prioritise when budgeting, balancing against other essentials like housing, heating and transport to work. In addition to this, there’s evidence that a sustained period of low consumer confidence is affecting the way we shop for groceries.
Not all food is equal and in some cases, consumers are more willing to loosen the purse strings. Previous research from Kantar suggests meals which have a health benefit, are convenient or are prepared for a social occasion all attract a price premium. Food which can demonstrate that it meets multiple needs is more likely to bag a bigger spend.
A note on sources:
International comparisons on food spend are made using the USDA Economic Research Service’s dataset which is calculated from Euromonitor estimations.
The UK’s ONS collects more detailed data on household expenditure in the Living Costs and Food Survey which has been running, under various guises, since 1957. Since 2001 family spending data has been calculated using the internationally-comparable ‘Classification of Individual Consumption by Purpose’ or COICOP. However, when making comparisons to spending in 1957, this data has been calculated using the system used in 1957.
Because these studies have different methodologies and different definitions they give slightly different results, illustrated above.


