Discounters have highest ever share as shoppers trade down stores
Wednesday, 24 August 2022
Discounters were growing at a rapid rate until the pandemic hit. In 2020, smaller stores and a lack of online presence hampered their share of the market.
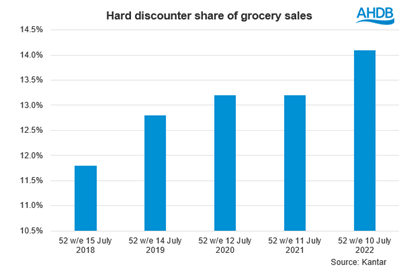
However, discounters have bounced back, and they now have the highest ever share of grocery, which is expected to increase further as the cost-of-living crisis leads more cash-strapped shoppers to the discount market.
IGD predict discounters will grow 23.9% over the next five years - the fastest and largest growth of grocery channels, delivering an additional £7.1bn in sales. Hard discounters (Aldi and Lidl) make up the majority of discount grocery sales. This definition of discounters also includes bargain stores (such as Poundland, Home Bargains etc) which are also in growth.
Discounters will be a natural beneficiary of shoppers’ desire to save money. Some shoppers have moved to cheaper stores to save money and discounters have a lower per item price distribution compared to competitors.
Hard discounters will also be supported by their continuing store expansion. Both Aldi and Lidl have aggressive plans for new stores and increasing their presence in urban areas with more local and convenience stores. This is potentially affecting the regional representation of shoppers, with the share of shoppers in the south increasing 4%pts quarter on quarter (IGD, April-June 2022). However, as other channels increase their competitive prices and loyalty schemes, discounters can’t afford to stand still.
In the last year, hard discounters made up 14.1% share of grocery sales, up from 11.8% in 2018. Due to lower price points, they have a larger volume share of the market, at 18.5% for 52 w/e 10 July 2022 (Kantar).

While food sales are on the rise, it has been reported that hard discounters are struggling with non-food sales as shoppers scale back on the famous middle aisle. However, this hasn’t impacted the household penetration with 70% of households using hard discount stores in the last year, up from 67% a year ago.
Which meat and dairy products are performing well in discount?
In the 12 weeks ending 12 June 2022, hard discounters accounted for 18.0% of dairy volumes and for the 12 weeks ending 10 July 2022, they accounted for 20.3% of meat, fish and poultry (MFP) volumes.
MFP
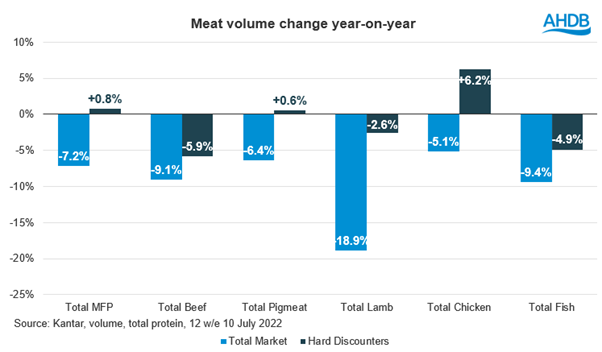
Hard discounters have a higher share of meat sales than total grocery share, accounting for 20.7% of pig meat volumes and 21.9% of chicken volumes, but only 13.6% of lamb (Kantar, 12 w/e 10 July 2022). It is unsurprising that overtrade in meat is driven by cheaper proteins, which are likely to appeal to price conscious shoppers. In general, discounters have a higher share of primary (e.g. steaks, chops, roasting joints) and processed meats (e.g. sausages, burgers, bacon). However, they under trade in other areas of meat such as ready meals and pies and pastries, where they account for only 16.0% of volume sales.
Money conscious shoppers are still looking for convenient meal options. Many turn to discounters for meals for tonight with 23% of shoppers looking for evening meal options for that day (IGD, April-June 2022). Having the right range of meal solutions could meet these needs for shoppers and boost discounters to achieve their fair share of the market.
As well as having a larger share, chicken and pig meat are areas which are in growth at hard discounters. While the total market sees decline across all proteins in the last 3 months, gains in chicken and pig meat in discounters led to an overall increase in volume sales of MFP.

Dairy
Hard discounters have a smaller share of dairy sales than we would expect with the slight under-trade driven by milk. Discounters account for only 16.5% of milk volumes as convenience and independent stores take a greater share (Kantar, 12 w/e 12 June 2022). The big 4 are able to maintain their share for milk, showing an opportunity for discounters to play more into the convenience channel and missions.
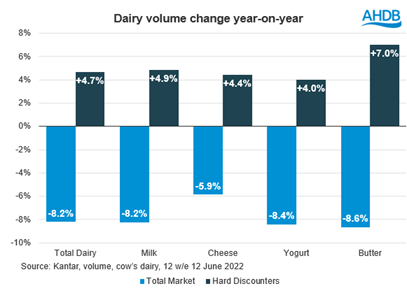
There is a strong over performance for other dairy categories with hard discounters accounting for 26% of cheese volumes, 24% of yogurt and 23% of butter.
Hard discounters are continuing to gain share in dairy as the market declines, but discounters see volume growth year-on-year. Discounters are seeing growth across all dairy categories, particularly ones which have seen high price inflation, such as butter.

What are discount shoppers looking for?
The main reason shoppers choose hard discounters is to save money, with price being the key driver for more than 8 in 10 discount shoppers, according to IGD (April-June 2022). Whereas being in a convenient location is the main driver for big 4 stores.
Shoppers use hard discounters for both main shops and top ups, but the favoured option differs between Aldi and Lidl. Aldi is used slightly more for big shops (51%) than top ups (39%), whereas it is the opposite at Lidl with shoppers using it more for top-ups (50%) compared to main shops (40%).
Both Aldi and Lidl are working on their environmental credentials. Lidl was the first supermarket to begin an eco-labelling trial in the UK, although small. Discount shoppers are also more interested in experimenting and trying new products than big 4 shoppers, which shows opportunities exist to influence shoppers in store with the right communications. See our improving shopper engagement with the meat aisle report for best practise and learning on how to communicate inspiration and environmental messaging in store.

Sign up to receive the latest information from AHDB
While AHDB seeks to ensure that the information contained on this webpage is accurate at the time of publication, no warranty is given in respect of the information and data provided. You are responsible for how you use the information. To the maximum extent permitted by law, AHDB accepts no liability for loss, damage or injury howsoever caused or suffered (including that caused by negligence) directly or indirectly in relation to the information or data provided in this publication.
All intellectual property rights in the information and data on this webpage belong to or are licensed by AHDB. You are authorised to use such information for your internal business purposes only and you must not provide this information to any other third parties, including further publication of the information, or for commercial gain in any way whatsoever without the prior written permission of AHDB for each third party disclosure, publication or commercial arrangement. For more information, please see our Terms of Use and Privacy Notice or contact the Director of Corporate Affairs at info@ahdb.org.uk © Agriculture and Horticulture Development Board. All rights reserved.

