May 2024 dairy market review
Thursday, 20 June 2024
Milk production
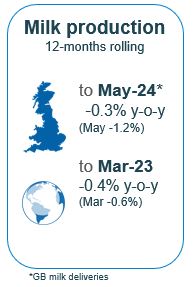
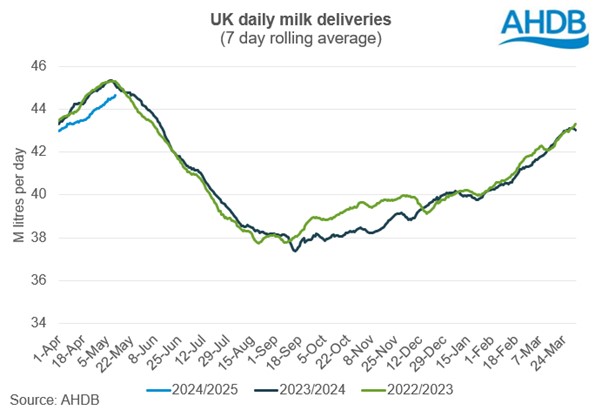
GB milk deliveries are estimated to have totalled 1,127 million litres in May 2024 with an average of 36.4 million litres per day. This would mean a decline of 1.2% year on year. This also means that dairy production for May was the lowest milk volume since 2016. Daily milk deliveries look to have peaked on 11 May at 36.92m litres per day meaning that we saw a subdued flush this year.
Prolonged wet conditions from autumn through to Spring not only held back cow turnout but have also delayed grass growth. Looking at peak growth, although this was down year on year, it was higher than the 5-year average, likely due to a break in the weather causing grass growth to shoot up in the early part of the month. See the latest grass growth data visualized on the Forage for Knowledge webpage. Although silage season is now well underway, the slower start may well put pressure on forage supplies later in the year. Paired alongside this, hay and straw prices are currently sitting at a record high and farmers will be hoping the weather picks up in time for harvest after last year’s damp summer.
However, cow numbers are reported to be steady. As of 1 April 2024, the latest BCMS data shows that the GB milking herd stood at 1.64 million head. This matches the figure recorded in 2023, despite lower farmgate milk prices. This supports wider commentary that the lower milk production seen so far this year has been the result of reduced yields, rather than herd size.
Organic production has continued to contract which has led to some speculation of shortages in the media. GB organic milk production averaged 1.1 million litres a day in May, down 9.7% compared to the same period last year. Production has declined significantly in recent years, primarily due to weakening consumer demand caused by the cost-of-living crisis. Over the 2023/24 milk year organic production was 14% down on 2022/23. There are now signs that demand for organic milk may be experiencing some resurgence which, if it continues, should offer some support for the sector going forwards.
Expectations for milk production for the 2024/25 milk year have been downgraded in AHDB’s latest forecast revision to -1% year-on-year due to the exceptional weather conditions.
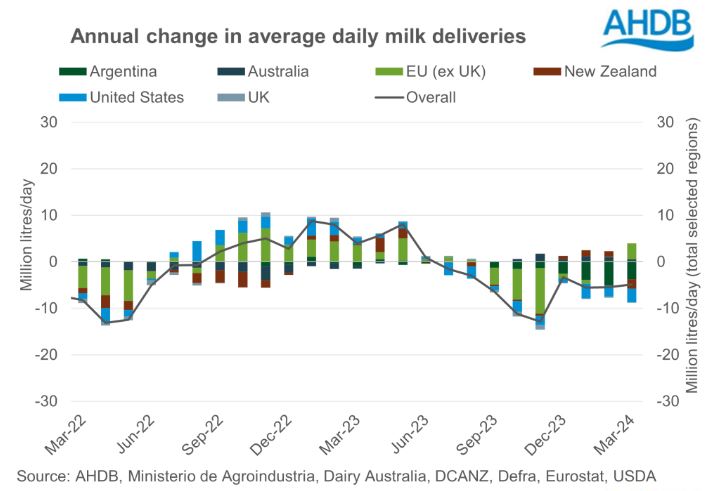
Global milk deliveries in the latest period (March) averaged 823.5 million litres per day in March, a decline of 4.9 million litres per day, or -0.6%), across the selected regions, compared to the same period last year. Australia and the EU recorded year on year volume increases, UK was stable, and Argentina, US and New Zealand declined. Looking at this EU figure in greater detail, we saw the greatest year on year volume change in Irish milk production, down 47.6 million litres (5.9%). Production in Poland was up, by 46.9 million litres (4.3%) and in France by 23.8 million litres (1.2%), on the previous year. German production was broadly stable whilst Italy inched up by 16.7 million litres (1.5%).
Available supplies and trade
Latest analysis of milk utilisation in the UK suggest that the trend away from processing into liquid milk has continued. In 2023, milk utilisation under the liquid milk category declined to 42% from 46% in 2015. In contrast to liquid milk, there has been a significant growth in the cheese category, which accounted for 34% of the milk utilisation in 2023 compared to 28% in 2015. Within the cheese category cheddar is by far the largest variety produced, accounting for 25% of total milk utilisation, and over 70% of cheese production. Yogurt has also seen growth and it now accounts for 3% of milk utilisation.
Total export volumes of dairy products from the UK have declined marginally in Q1 2024. Total export volume for Q1 2024 was 327,000 t, a decline of 2,300 t year-on-year. The level of EU exports remained almost at par, while exports to non-EU destinations declined by 2,300 t.
However, cheese, whey and yogurt saw significant year-on-year growth. This was driven by exports to both EU and non-EU nations. Cheese exports are the highest recorded in a quarter since 2020. Exports of cheese products saw the largest increase of 9,800 t followed by whey and whey products at 2,900 t respectively. Exports of yogurt registered an increase of 1,700 t while exports declined across other products in the basket. Cheese prices have been softening since the beginning of this year, making it attractive for buyers.
Wholesale markets
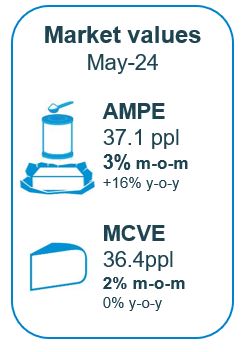
Despite all product categories recording an uplift in pricing in May, it was a month of two parts. All contributors noted that growth in prices only came in the last week to 10 days, as enquires increased following a disappointing peak in milk production. Prior to this, markets had been flat with little change from the previous month. Important to note that average prices are reflective of the whole of the 4-week period. Cream gained £67/t or 3%; butter gained £90/t or 3%; mild cheddar gained £70/t or 2%. SMP was less exuberant with a gain of only £10/t.
As of April, milk market values (which is a general estimate on market returns and the current market value of milk-based products on UK wholesale price movements) increased slightly to 36.5ppl. AMPE increased by 3%, MCVE gained 2%. AMPE is now ahead of a year ago by 16%, with MCVE flat.
Farmgate milk prices
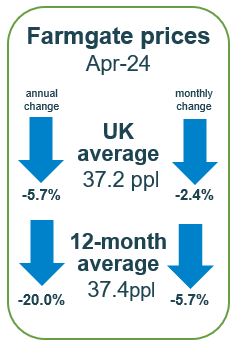
The latest published farmgate price was for April with a UK average of 37.2ppl, down 0.92 pence (2.4%) on the previous month. Latest announced farmgate prices for May were positive, continue the upward trajectory with processors becoming nervous about milk supplies.
Price increases on aligned liquid contracts were lower with marginal movements. Sainsbury’s increased their price by a marginal 0.02ppl while others held on to their price.
Non-aligned liquid contracts, moved more positively. Freshways edged up by 2.00ppl and Crediton Dairy moved up by 1.00ppl. Muller Direct increased their price by 0.50ppl whilst Paynes Dairies have held.
Cheese contracts were the most positive. Price changes were mostly in the range of 1.00 to 1.50ppl although First Milk Manufacturing and Leprino foods held steady for another consecutive month.
Manufacturing contracts also boosted prices. Arla Direct Manufacturing increased their price by 0.43ppl. UK Arla Farmers Manufacturing made positive move of 0.44ppl. Pattemores Dairy Ingredients followed others in the league and made an upward movement of 1.00ppl after holding steady for two months.
Demand
In the latest 52 weeks to 18th May according to Nielsen, volumes of cow’s dairy declined by 0.9% year-on-year but spend increased by 3.5% as inflation caused rises in average prices paid by 4.5%.
- Spend on cow's milk decreased by 2.8% and volumes declined by 1.9% year-on-year. Semi-skimmed cow’s milk volumes contributed most to the decline driven by a 3.0% reduction in occasions per buying household, year-on-year. Whole milk saw volumes purchased increase this period (+1.0%), due to an increase in shoppers.
- Volumes of cow's cheese increased by 1.8% year-on-year, and combined with average price rises of 8.0% year-on-year, caused spend on cheese to rise by 9.9%. Cheddar saw 2.4% increase in volumes sold, driven by an increase in volumes purchased per household. Cheddar accounted for 42.5% of all cow cheese sold. Other cows’ cheese, speciality and continental, and processed cheese also saw growth.
- Cow's butter saw a volume decline of 3.8%, despite a decrease of average prices paid (-1.0%). As a result, overall spend reduced by 4.8% year-on-year. Block butter saw volumes increase by1.5% due an increase in buying households.
- Volume sales of cow's yoghurt, yoghurt drinks and fromage frais increased by 5.1% and spend increased by 12.1%. Despite an average price increase by 6.6%, most of the cow’s yoghurt categories saw volume growth. Growth was driven by an overall increase in purchase occasions, as well as a rise in shopper numbers buying into the category.
- Cow's cream also saw slight volume growth, up 0.3% year-on-year, driven by more frequent shopping occasions. Double, sour, and Crème Fraiche all experienced volume growth.

Sign up to receive the latest information from AHDB.
While AHDB seeks to ensure that the information contained on this webpage is accurate at the time of publication, no warranty is given in respect of the information and data provided. You are responsible for how you use the information. To the maximum extent permitted by law, AHDB accepts no liability for loss, damage or injury howsoever caused or suffered (including that caused by negligence) directly or indirectly in relation to the information or data provided in this publication.
All intellectual property rights in the information and data on this webpage belong to or are licensed by AHDB. You are authorised to use such information for your internal business purposes only and you must not provide this information to any other third parties, including further publication of the information, or for commercial gain in any way whatsoever without the prior written permission of AHDB for each third party disclosure, publication or commercial arrangement. For more information, please see our Terms of Use and Privacy Notice or contact the Director of Corporate Affairs at info@ahdb.org.uk © Agriculture and Horticulture Development Board. All rights reserved.


