Search our website enhanced by Google.

Beef markets home
Market analysis
Global cattle prices
Supermarket red meat prices
UK slaughter and production
GB estimated slaughter
GB cattle carcase classification
GB household beef purchases
Red meat country of origin audit
Cost of production and performance
Fertiliser prices
Organic materials value calculator
Fuel prices
Hay and straw prices
Land and rent prices
Exchange rates
Auction market price reporting
Lamb markets home
Market analysis
Global sheep prices
Supermarket red meat prices
UK slaughter and production
GB estimated slaughter
GB sheep carcase classification
GB household lamb purchases
Red meat country of origin audit
Cost of production and performance
Fertiliser prices
Organic materials value calculator
Fuel prices
Hay and straw prices
Land and rent prices
Exchange rates
Auction market price reporting
Pork markets home
Market analysis
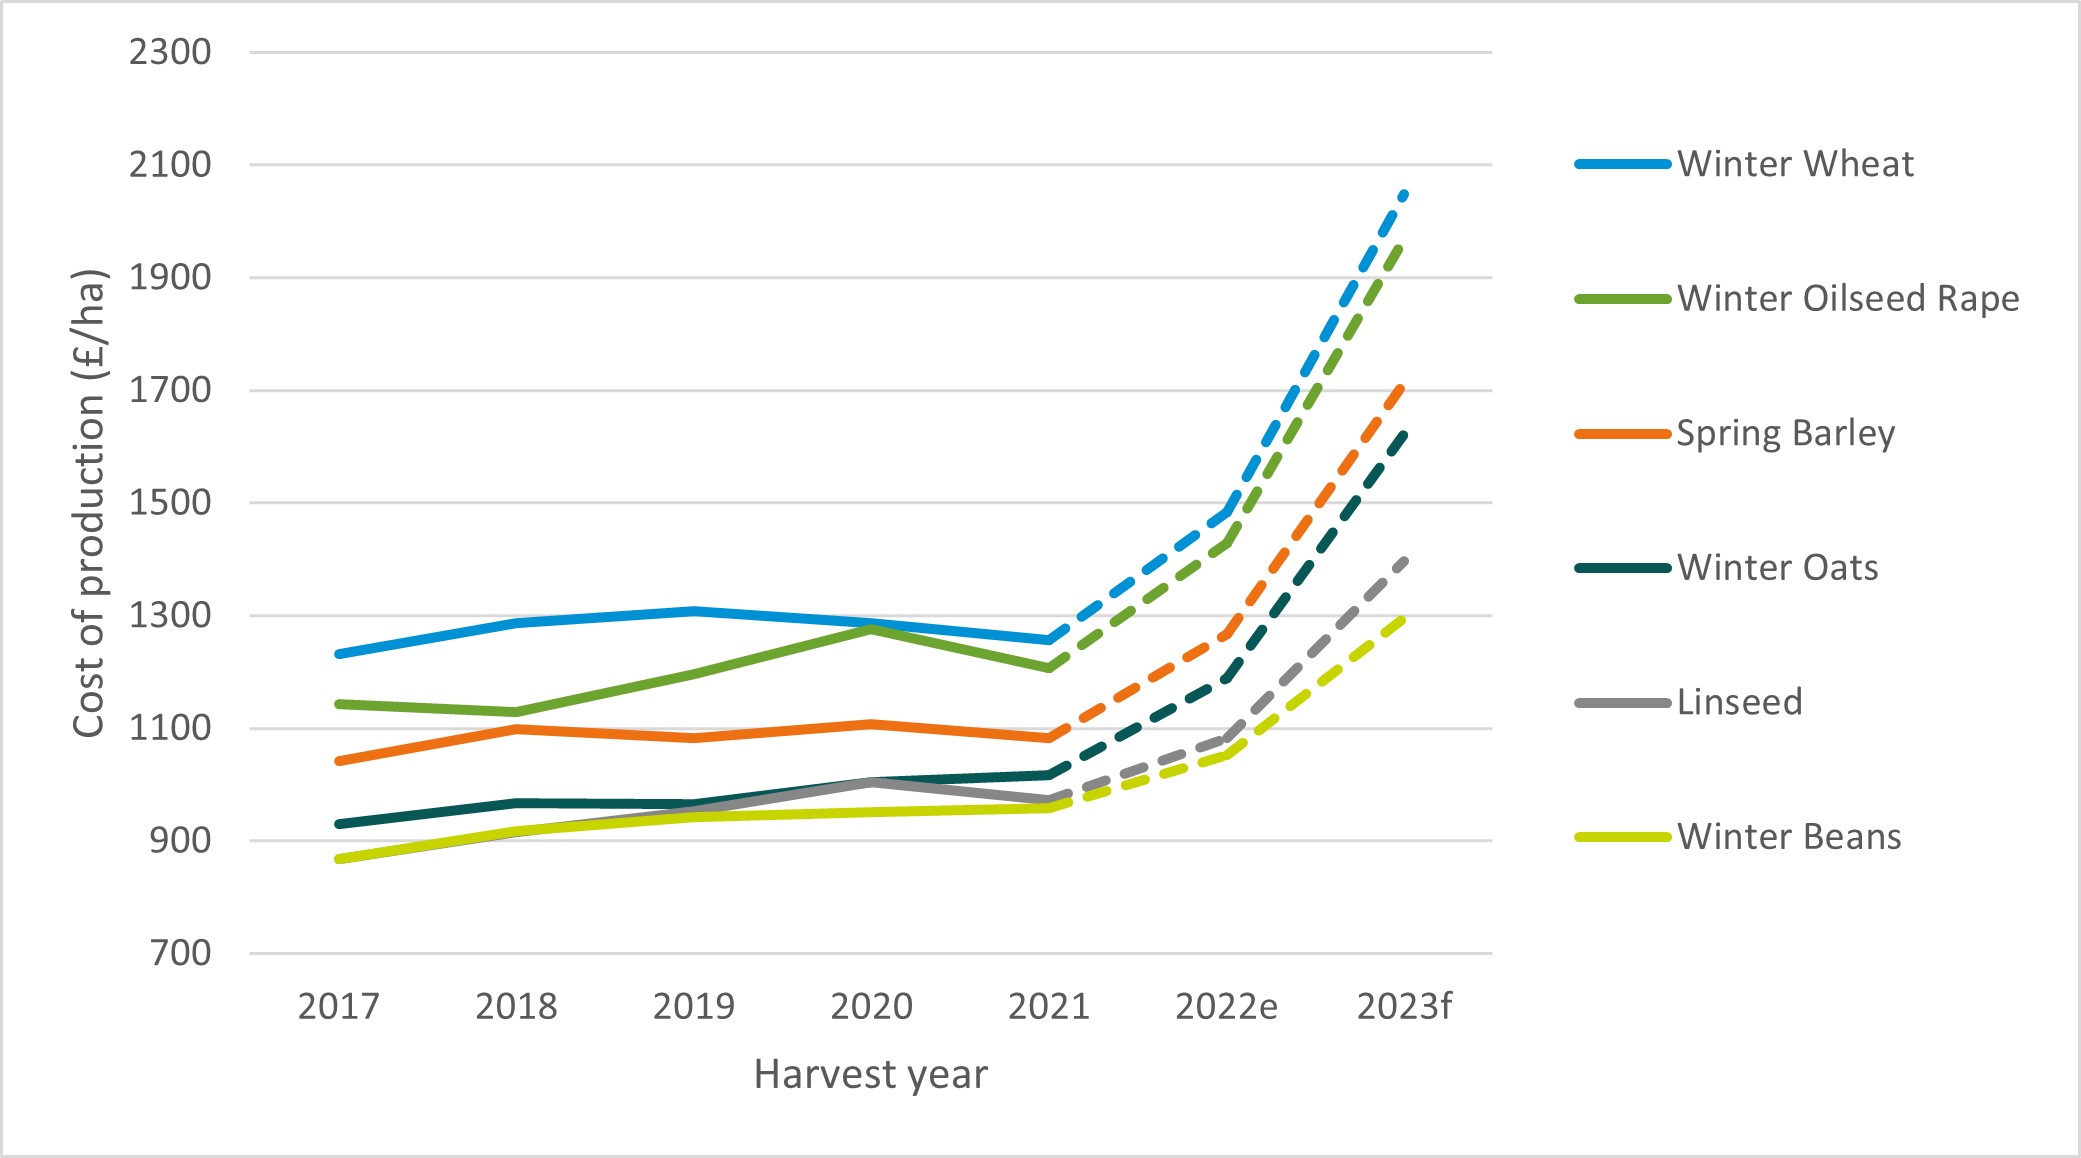
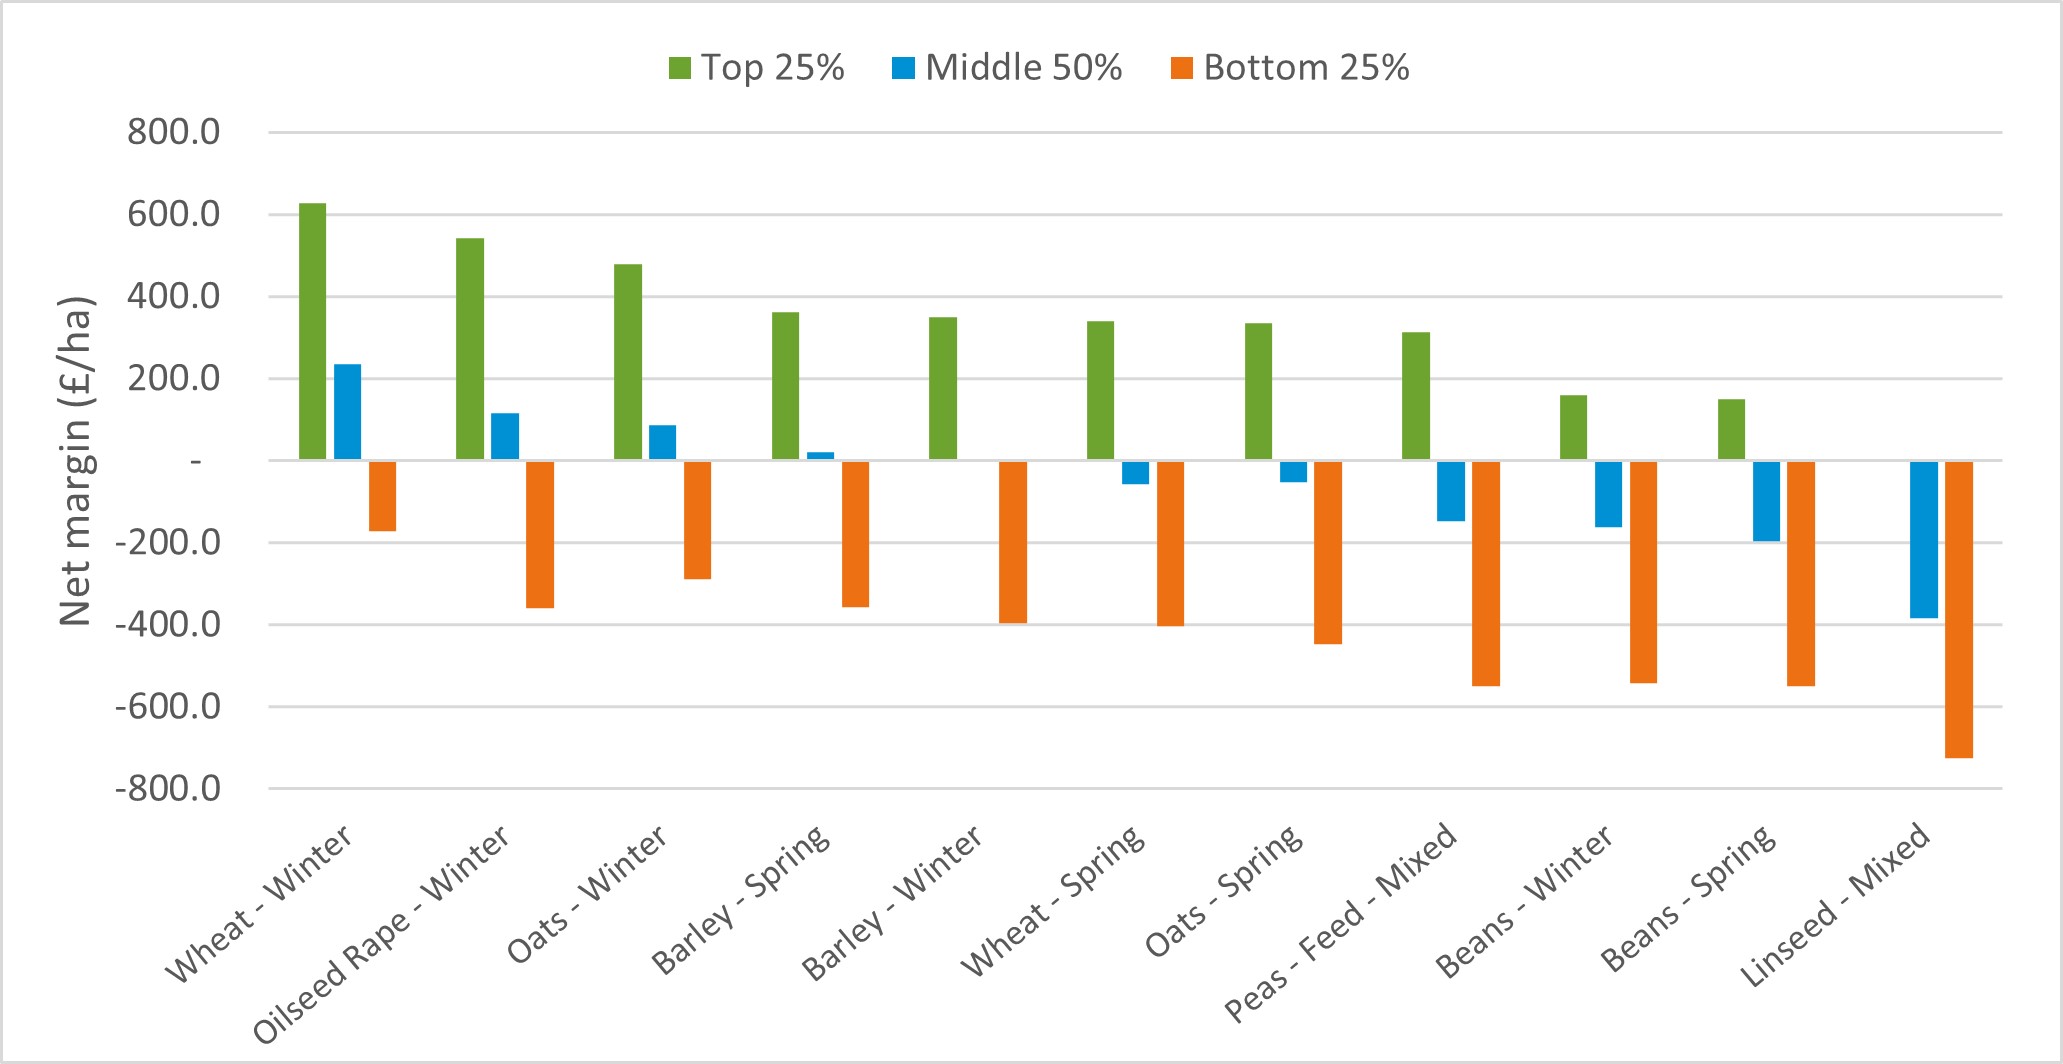
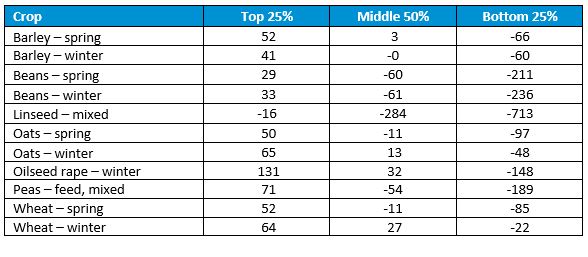
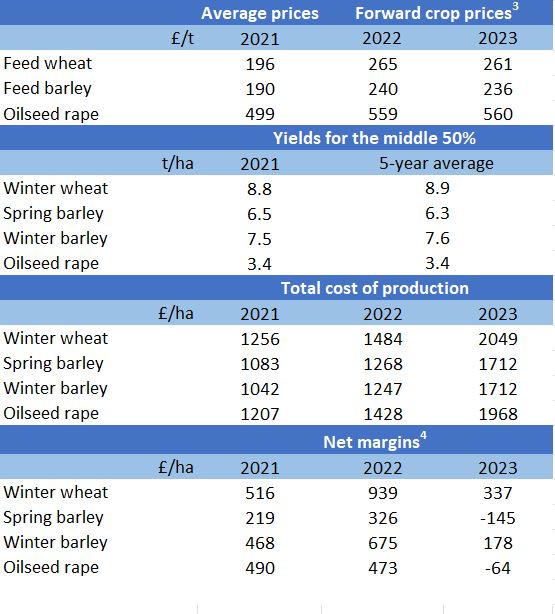
Cost of production and performance
GB deadweight pig prices (EU spec)
GB deadweight pig prices (UK spec)
UK and EU deadweight pig prices
EU weaner prices
Supermarket red meat prices
Pig to feed wheat price ratio
UK feed ingredient prices
Futures prices
Fertiliser prices
Organic materials value calculator
Fuel prices
Hay and straw prices
Land and rent prices
Exchange rates
UK pig meat marketing chain
UK pig numbers and holdings
EU pig numbers
England abattoir numbers
eFoodchain map
Dairy markets home
Market analysis
Milk price calculator
UK farmgate milk prices
Milk price changes
Milk price league table
Projected farmgate milk prices
Milk to feed price ratio
EU farmgate milk prices (incl. organic)
UK wholesale prices
EU wholesale prices
World wholesale prices
AMPE and MCVE
AMPE and MCVE calculator
Cream income to a liquid processor
Global Dairy Trade events
EU MCVE
Feed prices and markets
Promar Milkminder dairy costings
Kingshay dairy costings
Fertiliser prices
Organic materials value calculator
Fuel prices
Hay and straw prices
Land and rent prices
Exchange rates
UK and EU cow numbers
GB producer numbers
UK milk yield
UK processor numbers
Farm business income
eFoodchain map
UK daily milk deliveries
GB organic milk deliveries
UK monthly dairy product production
UK milk flow diagram
Milk Forecasting Forum
EU milk deliveries (incl. organic)
EU intervention stocks
Global milk deliveries
Cereals and oilseeds markets home
Market analysis
Futures prices
UK ex-farm prices (Corn Returns)
UK delivered prices
UK feed ingredient prices
UK import parities
UK export prices
Price risk management tools
Market data
Fertiliser prices
Organic materials value calculator
Fuel prices
Hay and straw prices
Land and rent prices
Exchange rates
UK cereals supply and demand estimates
GB animal feed production
UK human and industrial cereal usage
UK cereal stocks
Early bird survey
Crop development
Harvest progress
Planting and Variety Survey
Cereal Quality Survey
What are nature markets?
Nature markets available
How to engage and access nature markets
Choosing the right scheme
Nature markets FAQs
Retail and consumer insight home
Consumer attitudes
Retail market insight
Foodservice market insight
International insight
Agri Market Outlook
Data projects and products
Education
The environment
Exports
Events
Market intelligence
Marketing
Reputation
Research and Knowledge Exchange
Careers
Corporate strategy