August 2024 dairy market review
Tuesday, 10 September 2024
Milk production
GB milk deliveries are estimated to have totalled 991 million litres in August 2024 with an average of 32.0 million litres per day. This would mean a decline of 0.5% year on year. Declines in milk supplies have slowed since the early part of the year but are still running behind forecast with July and August together running 1.0%, or 20 million litres, behind forecast.
Recovery from the prolonged wet conditions from autumn through to Spring last year has been slow and grass growth has been behind average in August. See the latest grass growth data visualized on the Forage for Knowledge webpage. More positively, hay and straw prices have eased significantly from the record peak seen in July which will offer some comfort to farmers.
Cow numbers are reported to have declined a little. The latest BCMS figures record the GB milking herd at 1.61 million head, as of the 1 July 2024. This is down 0.3% on the previous year, driven by decreases across all age categories apart from 2-4 years. The average age of a cow in the GB milking herd now stands at 4.55 years, very slightly younger than last year’s figure.
The latest data continues to illustrate the long term trend of declining numbers of older cows in the GB dairy herd, with a 8,000 head year on year decline in the 6-8 years category and a further 7,000 loss in cows over 8 years. This represents the continued move of the industry to focus on improving genetic potential, prioritising the younger, likely higher genetic merit cows.
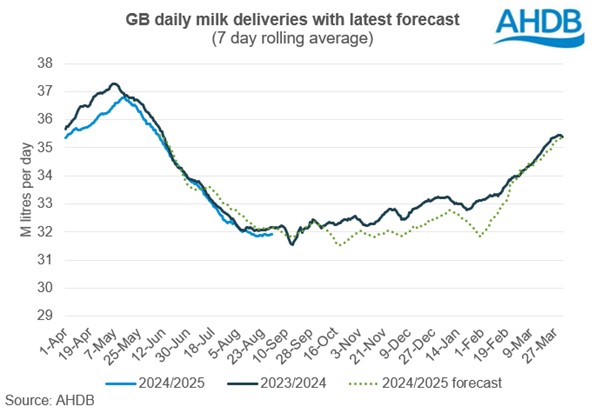
Expectations for milk production for the 2024/25 milk year will be revised at the next Milk Forecasting Forum in September to reflect changing market conditions.
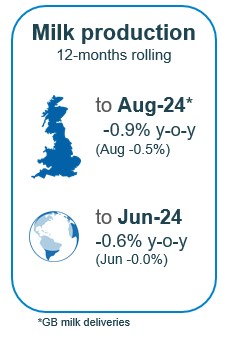
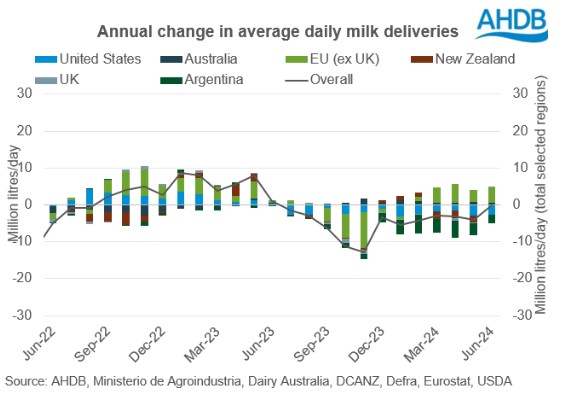
Global milk deliveries averaged 782.4 million litres per day in June, a slight decline of 0.1 million litres per day across the selected regions, compared to the same period last year. Australia and EU recorded year on year volume increases, whilst Argentina, US and New Zealand declined and the UK was stable. Milk deliveries in the EU averaged 409.1 million litres per day in June, an increase of 4.1 million litres per day (1.0%) compared to the same month of the previous year. Looking at this EU figure in greater detail, we saw the greatest year on year volume change in French milk production, up 54 million litres (2.9%). Production volumes in Italy and Poland were up, by 29million litres (2.9%) and 41 million litres (3.8) respectively. In Germany, production was flat on year ago levels and Irish volumes were back 13 million litres (1.3%).
Available supplies and trade
Tightening milk supplies in the UK impacted production of most dairy products in Q2 2024. Production of butter and cheese declined during the period whilst milk powders increased marginally. Cheese availability looked challenging but was boosted by an increase in imports resulting in an increase of 2% (3,500 tonnes) in the second quarter year-on-year. Interestingly cheese imports from New Zealand have picked up beginning this year following the trade deal. Most of the imports came from the EU followed by New Zealand. Butter production declined by 10% (6,000 tonnes) year-on-year in Q2 in spite of rising commodity prices. Milk powder production increased by 7% (2,000 tonnes) in Q2, but imports declined by 23% (2,000 tonnes) year-on-year. Exports fell by 37% (11,000 tonnes) which paired with production growth led to an increase in available supplies of 11,000 tonnes. Lower demand from MENA, Asia and the EU contributed to the decline in exports.
Total export volumes of dairy products from the UK declined by 2.6% in Q2 2024. Total export volume for Q2 2024 was 330,800 t. The level of EU exports declined by 1,700t, while exports to non-EU destinations declined by 7,000 t.
Despite the overall decline in exports, cheese, whey, milk and cream and yoghurt saw growth year-on-year. Cheese exports grew the most, increasing by 5,900t, followed by whey products at 2,600t. Exports of yoghurt increased marginally by 800t, however it is the highest recorded in a quarter since 2021. Exports of milk and cream increased by 1,900t. Increasing consumer demand for cheese supported the growth. Exports of powders declined very significantly by 16,600t (-34%) whilst butter declined by 3,300t (20%).
Wholesale markets
Many commentators have described the market as being ‘on fire’ in August, especially in the last 10 days (up until 12th August, which was the end of the reporting period). Although seasonal demand pick up is anticipated after the summer holiday period, the size of the uplift was reported to have taken some by surprise. This has supported product pricing across the board, alongside a lack of available supplies. Important to note that average prices are reflective of the whole of the 4-week period. Cream gained £67/t or 7%; butter gained £420/t or 7%; mild cheddar gained £90/t or 2%. SMP was, again, comparatively muted with a gain of only £10/t.
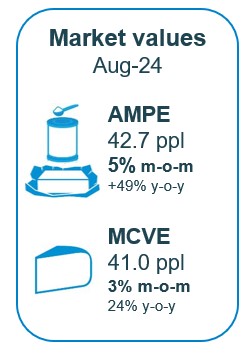
As of August, milk market values (which is a general estimate on market returns and the current market value of milk-based products on UK wholesale price movements) increased to 41.3ppl. AMPE increased by 5%, MCVE gained 3%. AMPE is now ahead of a year ago by 49%, with MCVE up by 24%
Farmgate milk prices
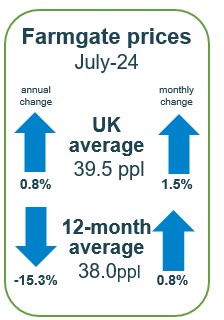
The latest published farmgate price was for July with a UK average of 39.5ppl, up by 1.5% on the previous month. Latest announced farmgate prices for September were positive for most (barring aligned which saw some declines in response to reducing costs of production), and continue the upward trajectory with processors still nervous about milk supplies.
Price increases on aligned liquid contracts were lower with marginal movements. Sainsbury’s increased their price by a marginal 0.02ppl while others held on to their price.
Cheese and manufacturing prices recorded increases in September for almost all contracts on the AHDB milk price changes table. Liquid contracts were more mixed, with some declines in aligned and some increases in non-aligned, amongst those holding steady.
Aligned contract changes were mixed in September. Tesco TSDG and Co-op Dairy Group both held their prices from the previous month, however Sainsbury’s dropped by 0.02ppl. M&S saw a larger decline, down 1.12ppl.
Looking to non-aligned liquid contracts, most contracts saw uplifts in September, except for Freshways where the price held steady, following a 3ppl increase last month. Crediton Dairy’s price increased by 1ppl whilst Muller lifted by 1.25ppl.
Almost all cheese contracts saw growth in prices for this month. First Milk Manufacturing, Leprino Food and South Caernarfon Creameries all rose by 1ppl. Lactalis gain 0.91ppl whilst Wyke was slightly higher at 1.04ppl. Barber’s price increased by 0.6ppl and Wensleydale grew by a smaller 0.2ppl. Saputo gained 0.25ppl whilst Belton Cheese held their price from the month before.
Prices on all manufacturing contracts on the AHDB league table increased in September. Arla Direct Manufacturing contracts were up 0.43ppl, whilst Pattemores Dairy increased their price by 1ppl. UK Arla Farmers Manufacturing rose by 0.89ppl.
Demand
In the latest 52 weeks to 13th July according to Nielsen, volumes of cow’s dairy declined by 0.1% year-on-year but spend increased by 1.6% as inflation caused rises in average prices paid by 1.7%.
- Spend on cow's milk decreased by 5.2% and volumes declined by 1.3% year-on-year. Semi-skimmed cow’s milk volumes contributed most to the decline driven by a 2.2% reduction in occasions per buying household, year-on-year. Whole milk saw volumes purchased increase this period (+1.4%), due to an increase in shoppers.
- Volumes of cow's cheese increased by 2.9% year-on-year, and combined with average price rises of 4.0% year-on-year, caused spend on cheese to rise by 7.0%. Cheddar saw 3.4% increase in volumes sold, driven by an increase in volumes purchased per household. Cheddar accounted for 42.6% of all cow cheese sold.
- Cow's butter saw a volume decline of 3.0%, despite a decrease of average prices paid (-2.2%). As a result, overall spend reduced by 5.1% year-on-year. Block butter saw volumes increase by 4.3% due an increase in buying households.
- Volume sales of cow's yoghurt, yoghurt drinks and fromage frais increased by 6.4% and spend increased by 11.0%. Despite an average price increase by 4.3%, most of the cow’s yoghurt categories saw volume growth with the healthy category seeing a 19.7% increase in volumes.
- Cow's cream grew by 1.4% year-on-year, driven by more frequent shopping occasions and helped by average price declines. Double, sour, and Crème Fraiche all experienced volume growth.

Sign up to receive the latest information from AHDB.
While AHDB seeks to ensure that the information contained on this webpage is accurate at the time of publication, no warranty is given in respect of the information and data provided. You are responsible for how you use the information. To the maximum extent permitted by law, AHDB accepts no liability for loss, damage or injury howsoever caused or suffered (including that caused by negligence) directly or indirectly in relation to the information or data provided in this publication.
All intellectual property rights in the information and data on this webpage belong to or are licensed by AHDB. You are authorised to use such information for your internal business purposes only and you must not provide this information to any other third parties, including further publication of the information, or for commercial gain in any way whatsoever without the prior written permission of AHDB for each third party disclosure, publication or commercial arrangement. For more information, please see our Terms of Use and Privacy Notice or contact the Director of Corporate Affairs at info@ahdb.org.uk © Agriculture and Horticulture Development Board. All rights reserved.


