- Home
- Knowledge library
- Soil fertility and structure for rotational grazing
Soil fertility and structure for rotational grazing
In this section of our rotational grazing systems for suckler producers series we look at soil health.
Compaction
Over 60% of grassland soils in England and Wales show signs of compaction. Compaction can seriously limit sward productivity by:
- Restricting the depth of root penetration
- Limiting plant nutrient and water uptake
- Increasing the susceptibility of swards to both flooding and drought by restricting soil moisture movement
Having higher stocking rates increases the risk of compaction, particularly in wet weather
Silty and fine sandy soils are most at risk from soil pans which tend to hold water above them, causing soil slumping.
Effective identification and elimination of soil compaction is essential to optimising production from both grazing and silage swards.
Assess the fields that are becoming part of the grazing rotation using a spade and our How to assess soil structure (VESS) guide.
This is to check for issues but also to act as a baseline so when soils are rechecked after the first grazing year, any changes can be tracked.
If your soil structure scores four or five you need to consider options such as sward lifting or using a grassland subsoiler.
Find out how to identify, solve and prevent soil compaction
Look at your soil test results
A soil test (pH, phosphate, potash and magnesium) needs to be available on the fields being allocated to the grazing rotation as soil nutrients, along with poor soil structure, will limit future yields.

The importance of nutrients
The correct soil pH helps grassland productivity by:
- Encouraging better earthworm and soil bacterial activity
- Improving nutrient uptake and release
- Encouraging prolific grass and clover growth
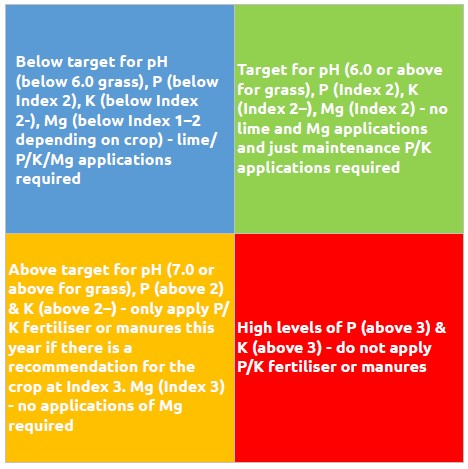
Target pH of 6.0–6.2 for mineral soils.
Sufficient phosphate and potash are essential to sward productivity. Poor overall sward growth is a symptom of insufficient phosphate.
A shortage of potash shows up as:
- A lack of growth, vigour and persistency in ryegrasses and clovers
- The replacement of ryegrasses by other species more tolerant of a lower potash status
Targets = P index of 2 and K index of 2 -
Magnesium is needed by the plant and by the animal. The interaction between magnesium and potash can lead to issues with grass staggers.
Target = Mg index of 2
Case study: Johnny Haimes – Using nutrient management plans
Find out how Johnny uses his soil test to inform his fertiliser applications.

By Luppo Diepenbroek
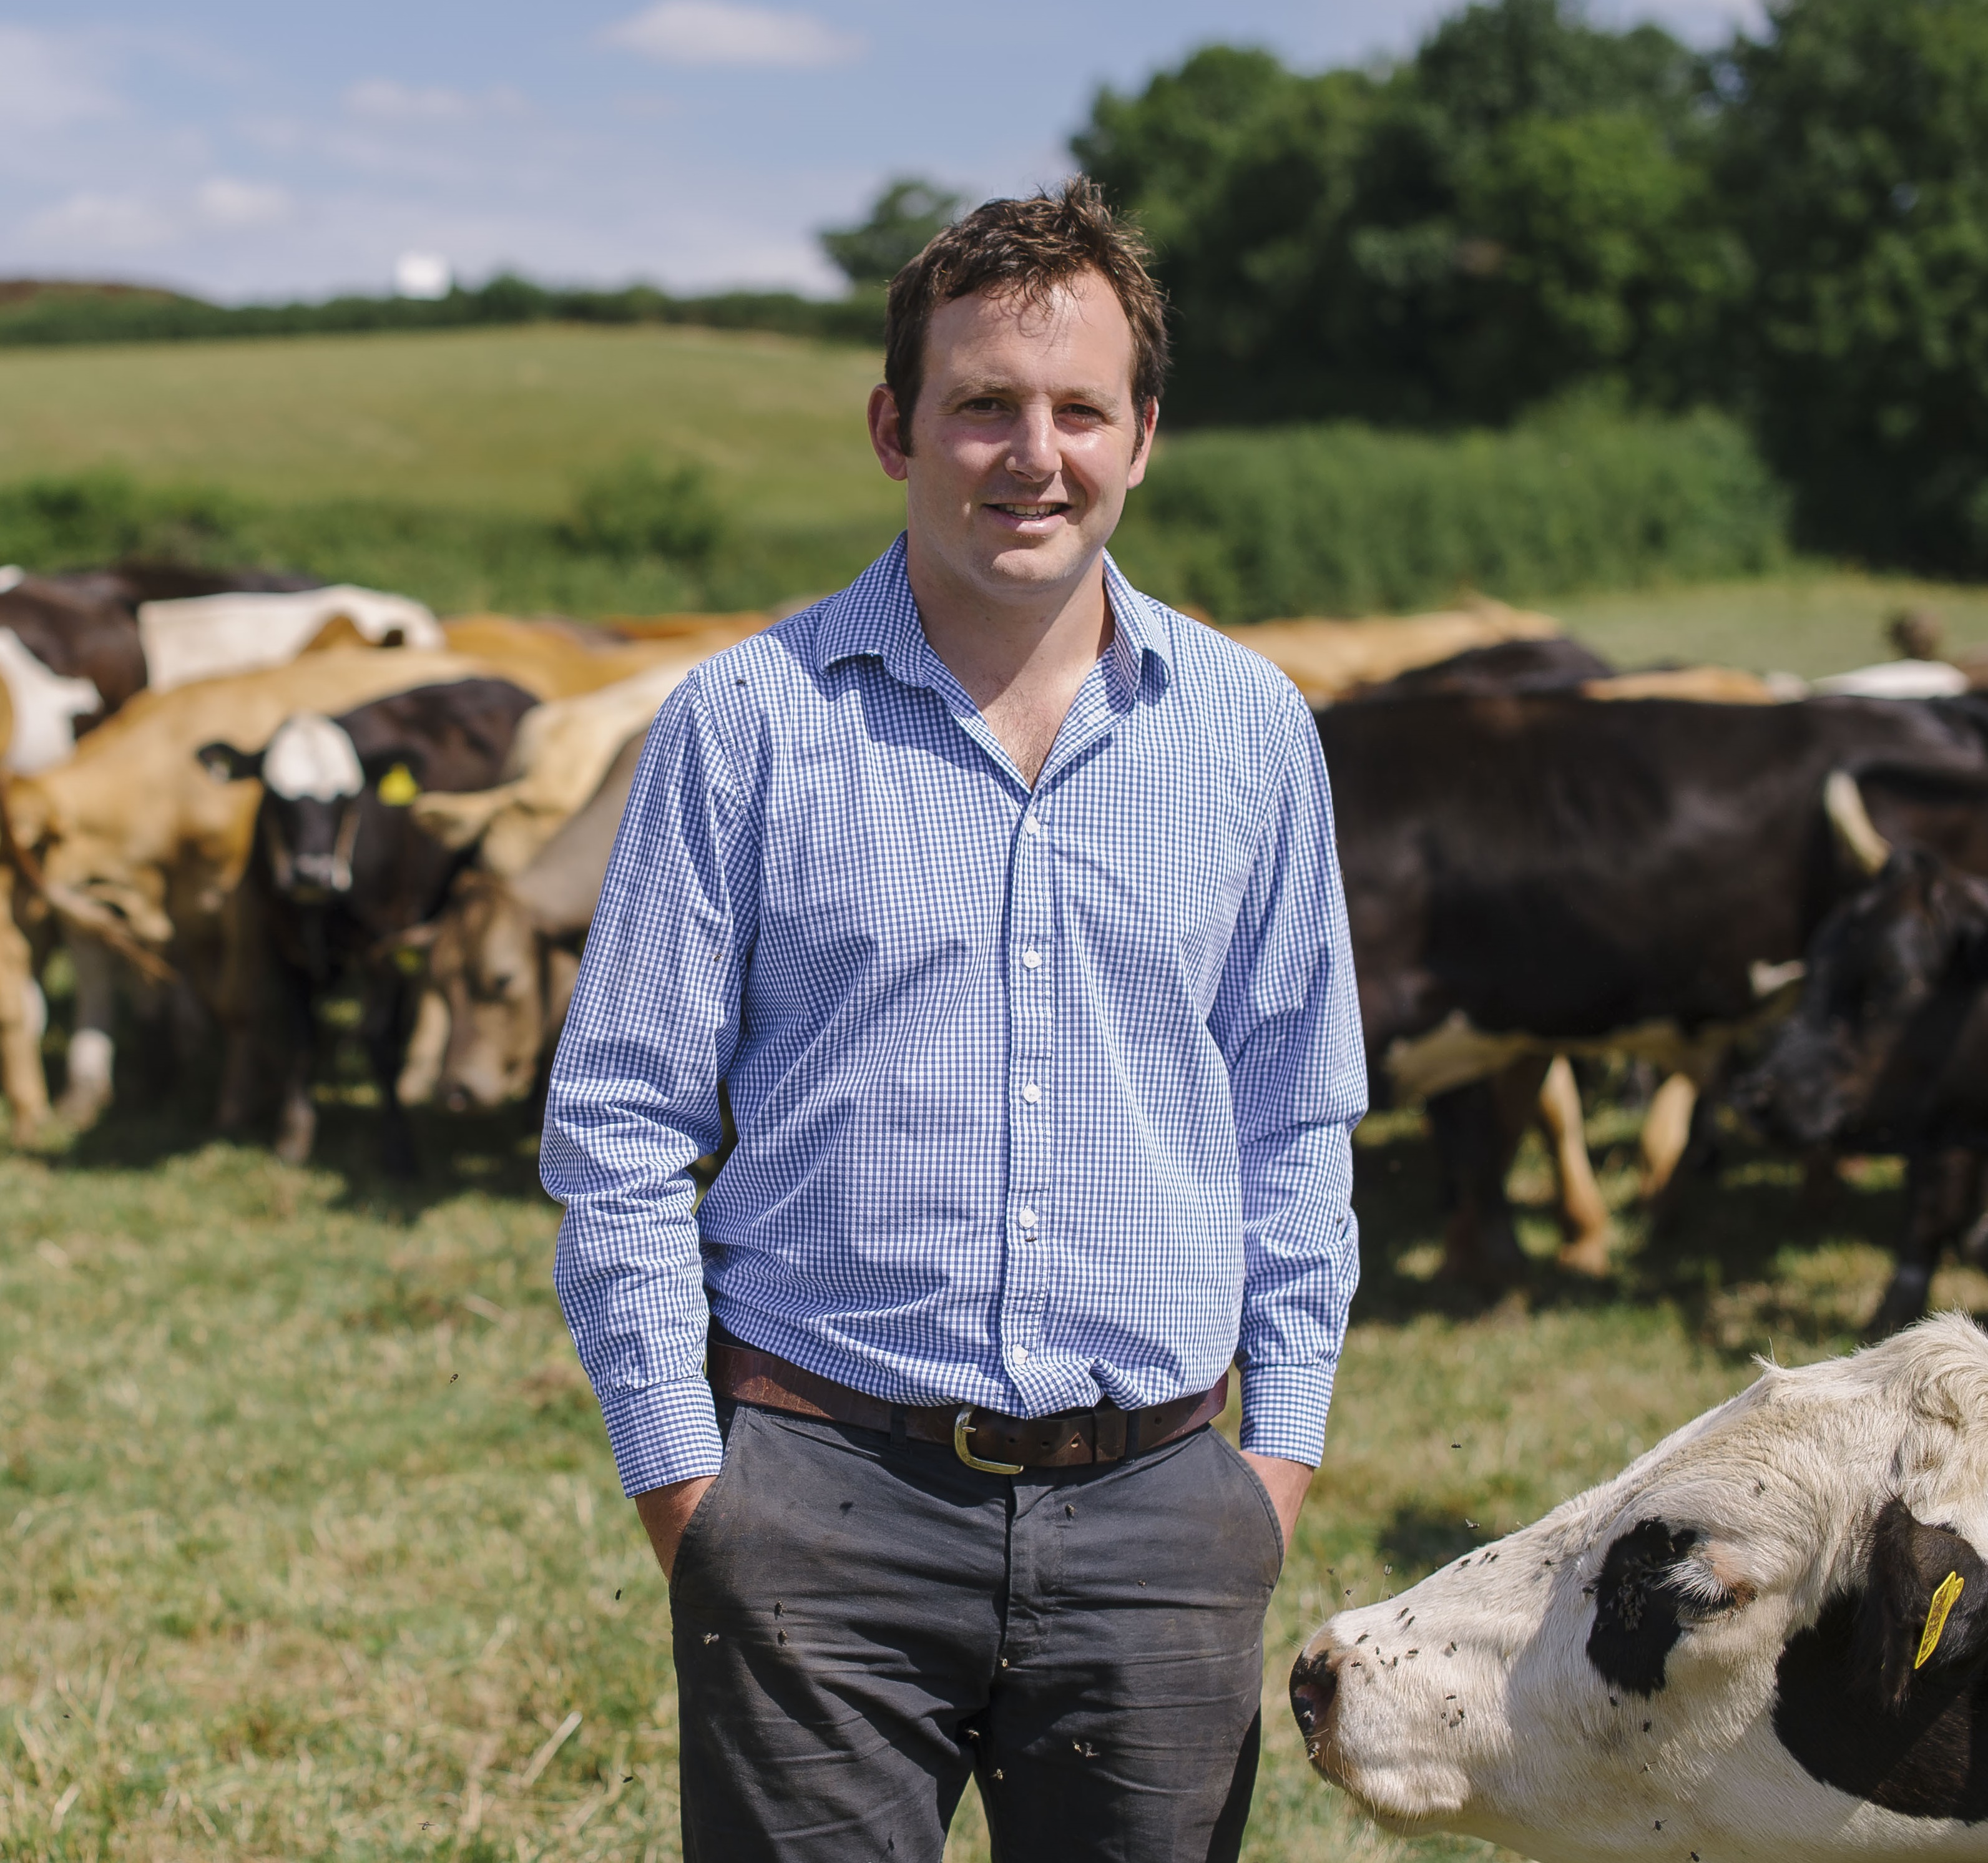
Johnny Haimes farms 230 ha of arable and grassland near Plymouth, South Devon. The beef herd consists of 100 crossbred cows, with youngstock sold as stores.
Johnny is one of our strategic farmers and at the start of the programme, a nutrient management plan was created, based on soil and manure nutrient tests.
Johnny has been implementing this plan over the last couple of years. Of the seven fields sampled that were not within a Higher Level Stewardship (HLS) scheme, most were identified as being low in pH and potash (K).
Johnny’s soil analysis results:
To rectify the low pH, in the spring of 2018, Johnny applied:
- Lime across the fields identified, at one tonne per acre
- Inorganic fertiliser and farmyard manure at 4 t/acre across the fields identified low in potash to bring indexes back to optimum
- A split dressing consisting of 21:10:12 at 101 kg/acre, then again later in the season at 14:14:14 at 63 kg/acre, in line with recommendations according to RB209
The analysis of Johnny's farmyard manure
|
Determined on a DM basis unless otherwise indicated |
Units |
Result |
Amount per fresh tonne |
Amount applied at an equivalent total Nitrogen application of 250 kg N/ha |
Units |
|
Oven dry matter |
% |
18.6 |
186.00 |
10121 |
kg DM |
|
Total nitrogen |
% w/w |
2.47 |
4.59 |
250 |
kg N |
|
Total phosphorus (P) |
% w/w |
0.851 |
3.62 |
197.25 |
kg P2O5 |
|
Total potassium (K) |
% w/w |
4.24 |
9.46 |
514.98 |
kg K2O |
|
Total magnesium (Mg) |
% w/w |
0.597 |
1.84 |
100.31 |
kg MgO |
|
Total copper (Cu) |
mg/kg |
37.2 |
0.01 |
0.38 |
kg Cu |
|
Total zinc (Zn) |
mg/kg |
163 |
0.03 |
1.65 |
kg Zn |
|
Equivalent field application rate |
— |
1.00 |
54.42 |
tonnes/ha |
|
Johnny will sample these fields again in 2021, four years after the initial test was carried out. This will provide him with the information required to make informed decisions about his fertiliser practice.


