US pork update: a challenging domestic market
Wednesday, 27 September 2023
Key trends
- US pork production for the year to date (Jan-Jul) stands at 7.1 million tonnes and is forecast to end the year 1.4% ahead of volumes for 2022
- Wholesale prices remain under pressure, whilst declining hog prices are largely reported as below producers cost of production
- US exports have grown 8% year on year, meanwhile imports have fallen 23%
- There are significant changes ahead for the US pork industry, with state laws focusing on animal welfare being introduced
Production
The USDA reports that the US inventory of pigs stood at 72.4 million head on 1 June 2023, a marginal increase (0.1%) from numbers recorded in June last year. This has been driven by growth in the number of market pigs, up 0.2% year on the year at 66.2 million head, outweighing the 0.4% decline recorded in the breeding herd, which stands at 6.1 million head.
Despite this relatively stable pig population, US pork production is forecast to reach 12.4 million tonnes in 2023, a 1.4% increase on 2022 volumes. For the year to date (Jan-Jul), the US has produced 7.1Mt of pork, 1.0% ahead of the volumes produced in the same period last year. This growth has been driven by an increase in slaughterings which total 73.0 million head of pigs for the period, a 2.0% increase compared to the last year.
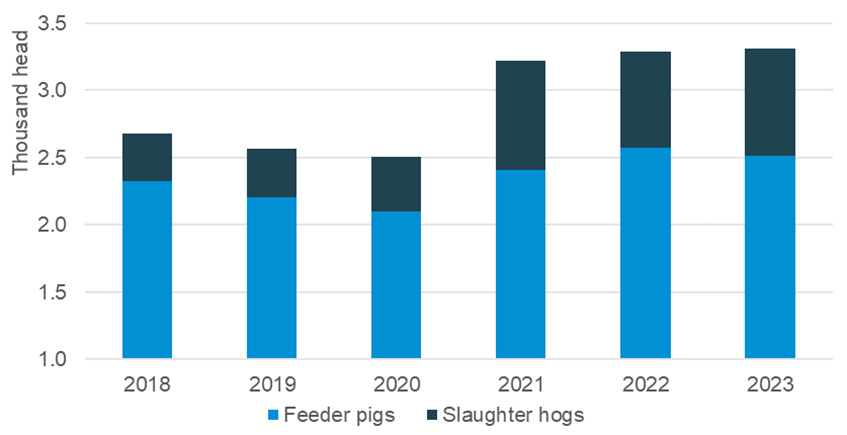
In the first six months of 2023, total live pig imports to the US totalled 3.3 million head, the majority of these pigs are finishing/feeder pigs and hogs for immediate slaughter moving from Canada to the US. Increased live imports from Canada is a trend that has been continuing since 2021 as the cost of raising pigs in Canada rose, leading some slaughter facilities to close.
US imports of live pigs Jan-Jun

Source: USDA, Economic Research Service calculations using data from U.S. Department of Commerce, Bureau of the Census.
Prices
Hog prices so far in 2023 have largely traded below 2022 levels and below most producers’ cost of production, with average live equivalent prices in August standing at USD$71.51/head, 16.5% lower than a year ago. As we move into the autumn/winter months, slaughter numbers generally pick up, resulting in a seasonal decline in prices.
Wholesale pork markets in the US have been showing similar trends to hog prices, sitting behind 2022 pricing. Domestic pork demand typically peaks in the summer months and declines as the year goes on, again seasonally lowering prices. However, there is added complexity to consumer demand with new state laws being introduced (see below), these laws are likely to be creating further pressure on the market.

Copyright: USDA, Economic Research Service
Trade
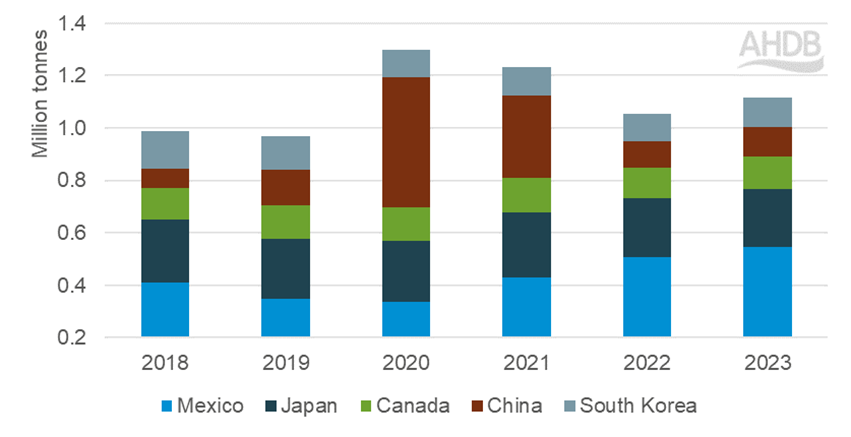
For the year to date (Jan-Jul) US pork exports (excluding offal) total 1.41 million tonnes, an increase of 8% year on year. A combination of good supply and competitive pricing has resulted in significant increases in volumes shipped to most of the key destinations, with the exception of Japan and Colombia.
Almost 40% of US pork exports go to Mexico, a growing market for pork and specifically US pork, considering the geographical location. Volumes shipped to Mexico have grown just shy of 40,000 tonnes in 2023 compared to 2022. Although Australia is only the seventh largest destination of US pork, import volumes from the US saw the second strongest growth year on year, up by nearly 16,000t. Other key importers such as Canada, China and South Korea also recorded strong import growth, with volumes up 7,400t, 11,200t, 7,700t respectively.
Top 5 destinations of US pork export volumes

Source: US Census Bureau, compiled by Trade Data Monitor LLC
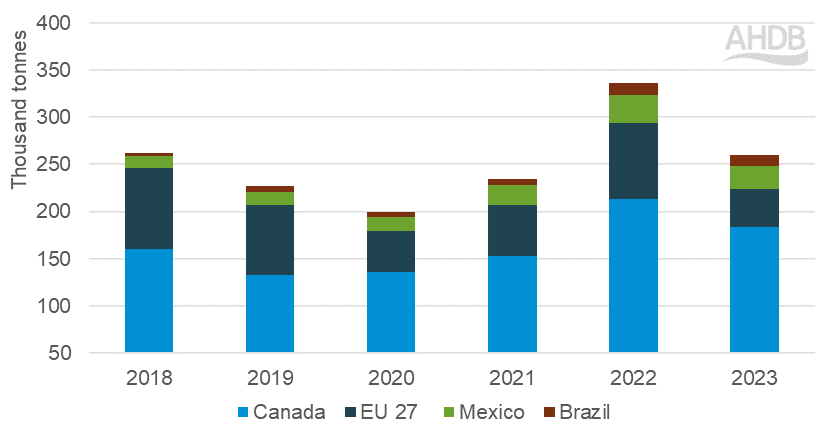
The US still remains a key importer of pork on the global market, with a total of 264,800t shipped to the US so far this year (Jan-Jul). Although this volume is down a substantial 80,000t (-23%) year on year, the volumes are in line with previous years. Canada remains the most significant provider of pork to the US holding a 70% market share. Lower production volumes and high pricing in the EU 27 has likely been the main driver for import volumes from the region declining by 50%, year on year.
Top 5 sources of US pork imports

Source: US Census Bureau, compiled by Trade Data Monitor LLC
New state laws
Although not in force yet, the introduction of Proposition 12 in California will likely have a severe impact on the US pork industry. Producers and the wider supply chain will likely have to pay out for extensive changes to their facilities to meet the new domestic market requirements, with substantial cost implications. Furthermore, California is not the only state looking to make law changes, with another 9 states including Massachusetts making similar proposals. Not only will these actions inevitably increase the cost base for pork across the US, which will likely negatively impact domestic consumption. We may see further pressure on producer numbers if they feel that returns will not outweigh the financial investments. There are also likely to be wider implications with current trading partners such as Canada, where production regulations will differ, limiting the destinations available to Canadian pig meat and products, unless Canada decides to make similar industry changes.

Sign up for regular updates
Subscribe to receive pork market news straight to your inbox. Simply complete our online form.
While AHDB seeks to ensure that the information contained on this webpage is accurate at the time of publication, no warranty is given in respect of the information and data provided. You are responsible for how you use the information. To the maximum extent permitted by law, AHDB accepts no liability for loss, damage or injury howsoever caused or suffered (including that caused by negligence) directly or indirectly in relation to the information or data provided in this publication.
All intellectual property rights in the information and data on this webpage belong to or are licensed by AHDB. You are authorised to use such information for your internal business purposes only and you must not provide this information to any other third parties, including further publication of the information, or for commercial gain in any way whatsoever without the prior written permission of AHDB for each third party disclosure, publication or commercial arrangement. For more information, please see our Terms of Use and Privacy Notice or contact the Director of Corporate Affairs at info@ahdb.org.uk © Agriculture and Horticulture Development Board. All rights reserved.

