Understanding Defra’s UK total income from farming numbers: Grain market daily
Friday, 26 May 2023
Market commentary
- UK feed wheat futures (Nov-23) closed yesterday at £187.55/t, gaining £2.60/t on Wednesday’s close. The Nov-24 contract closed at £196.00/t, gaining £2.00/t over the same period.
- Global wheat contracts were mixed yesterday, with some uncertainties surrounding the Black Sea Grain Initiative and fresh export demand, meeting favourable crop weather and ample Russian supply. It has been reported that dozens of ships are unable to reach Ukraine, with the pace of shipment unlikely to pick up due to slow inspections (Refinitiv).
- Further to that, Russia signalled yesterday that if demands are not met to facilitate and improve their grain and fertiliser exports then the deal will not be extended beyond 17 July. Something to watch going forward.
- Paris rapeseed futures (Nov-23) closed yesterday at €413.50/t, gaining €5.25/t on Wednesday’s close. Despite pressure on Chicago soyabeans yesterday from weak US export sales, rapeseed prices gained with palm oil. Palm oil felt support from a weaker currency as well as concern rising that the El Niño weather pattern could potentially hit production next year.

Understanding Defra’s UK total income from farming numbers
On 25 May, Defra released the 2022 total income from farming in the UK (TIFF) numbers, as well as the total factor productivity of the agricultural industry.
The release stated the UK TIFF in 2022 was pegged at £7.9 billion. This is an increase of 16.6% (£1.1 billion) from 2021 mainly due to higher commodity prices boosting output. This was particularly marked across arable and dairy markets, reportedly offsetting the input price rises in 2022.
So, what is the TIFF and what does it mean? Today I dig a little deeper into the output numbers, what are they? And importantly, what the output numbers by sector do not show. Agriculture is in a high-cost climate, which has brought many challenges across the industry.
What is TIFF? Total income from farming (TIFF) in the UK is explained by Defra to be the income of those who own businesses within the agricultural industry, adjusted for inflation. The total UK number is total profit calculated by Defra, from all UK farming businesses by calendar year, measuring return for management, inputs, labour and capital invested. Government support payments are included too.
Looking at the numbers
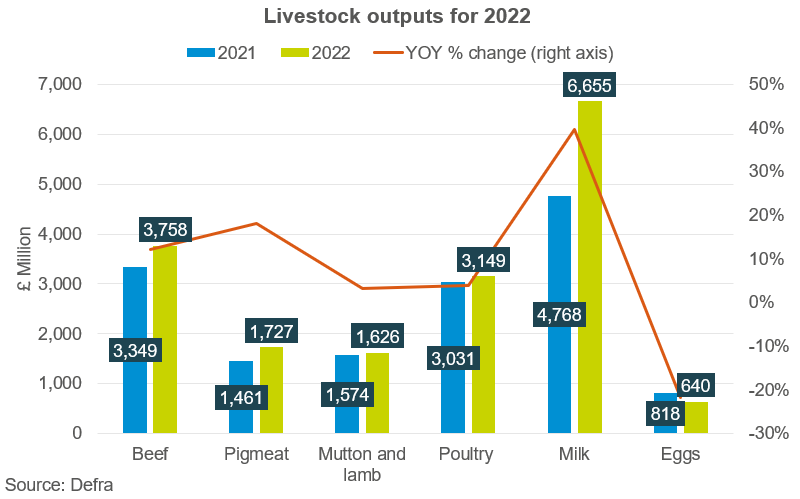
The TIFF number is calculated from total input and output numbers, as well as fixed capital. Total livestock output in 2022 was pegged by Defra at £19.3 billion, up 16.2% (£2.7 billion) from 2021, driven by rising milk prices. Using the AHDB average farmgate milk prices, we know that milk prices reached a peak at 51.60 ppl in December 2022. However, 2023 has started to see prices coming back again, quoted in March 2023 at 45.98 ppl and set to continue to fall further along with tumbling wholesale market prices.
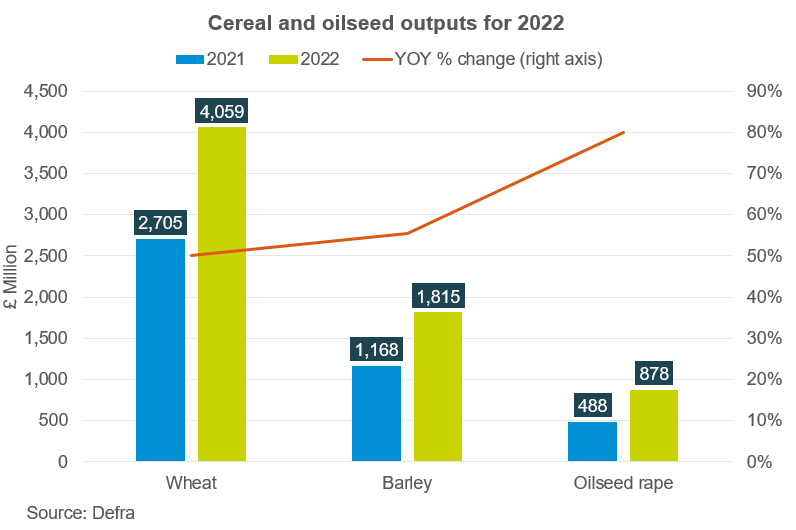
Total crop output was pegged by Defra at £13.3 billion in 2022, up 21.9% (£2.4 billion) from 2021. This was reportedly due to increased wheat prices, pushed higher by the outbreak of war in Ukraine, and a larger 2022 crop. In May 2022, nearby UK feed wheat futures peaked at £361.00/t. In recent months, global and domestic grain and oilseed prices have seen significant pressure from competitive Black Sea supply and good global crop prospects for 2023, and to yesterday’s close nearby UK wheat futures are down over 50% from this peak.
On the other side of the coin, Defra pegged intermediate consumption (inputs) at £22.1 billion in 2022, up 19.2% (£3.6 billion) year-on-year. This rise was predominantly driven by increased compound animal feed and fertiliser values. GB imported AN fertiliser price peaked in September/October 2022 at £870/t, with May 22 prices at £731/t. This is up over 170% from May 2021. Although when inputs were purchased, will be important to consider in this total value, and the impact on the TIFF.
A closer look by sector… outputs do not reflect margins
These output numbers may not be surprising for some, considering the previously mentioned high prices reached in 2022 for arable and dairy sectors specifically. However, key considerations especially for grain and oilseed outputs is when crops were sold, considering this metric is by calendar year. Reduced output from eggs also may not be surprising considering the recent challenges of energy costs, Avian Flu and tight margins. Though for other sectors, results may seem surprising.
It is important to consider that these output numbers, although they filter into the TIFF which takes account of input costs across all sectors, do not reflect the cost and margin picture by sector.
Last year brought cost challenges across sectors, as shown in the higher consumption figures. Key inputs rose at a higher rate than outputs in 2022 (Agricultural Price Index). As Freya discussed in her recent input cost inflation article, this trend continues in 2023. High energy, feed and fertiliser costs squeezed margins across sectors, particularly livestock.
Looking to the pork sector specifically, we know the huge challenges of negative margins that were experienced by producers throughout 2022, which is not reflected by the increase in total pigmeat output. In Q1 and Q2 of 2022, margins were as low as -£58/head and -£52/head respectively. In the latest data in Q1 for 2023, margins remain marginally negative at -£1/head.
A look to 2023 – falling prices but costs remain high
So, what does this mean for 2023? Well, the picture looks challenging for many. For agricultural inputs, costs remain historically high still, with some ‘baked in’ according to the Anderson’s 2023 Outlook. Though with grain prices falling, this may look to ease the feed cost outlook for some, energy prices and wages especially remain elevated. Fertiliser prices too have come back, though remain historically high.
On the output side, prices for some sectors are weakening. For example, previously mentioned arable and dairy sectors. The outlook for cereals and oilseeds remains bearish, with high wheat availability expected domestically and on the continent into the new season. With Direct Payments reducing too, this creates a more difficult environment for margins this year.
Sign up for regular updates
You can subscribe to receive Grain Market Daily straight to your inbox. Simply fill in your contact details on our online form and select the information you wish to receive.
While AHDB seeks to ensure that the information contained on this webpage is accurate at the time of publication, no warranty is given in respect of the information and data provided. You are responsible for how you use the information. To the maximum extent permitted by law, AHDB accepts no liability for loss, damage or injury howsoever caused or suffered (including that caused by negligence) directly or indirectly in relation to the information or data provided in this publication.
All intellectual property rights in the information and data on this webpage belong to or are licensed by AHDB. You are authorised to use such information for your internal business purposes only and you must not provide this information to any other third parties, including further publication of the information, or for commercial gain in any way whatsoever without the prior written permission of AHDB for each third party disclosure, publication or commercial arrangement. For more information, please see our Terms of Use and Privacy Notice or contact the Director of Corporate Affairs at info@ahdb.org.uk © Agriculture and Horticulture Development Board. All rights reserved.


