How has volatility in store cattle prices affected profitability on farm? Beef market update

Friday, 21 August 2026

While record store and finished cattle prices in the last two years have generated opportunities for some producers, others have seen margins disappear because purchase prices rose faster than sale values.
For businesses buying cattle, profitability is determined not by the sale price alone, but by the margin between purchase, production and sale. This article explores the margins of buying and selling cattle at different intervals in the last few years, with some mitigation strategies to consider.

Key points

  • Volatile cattle prices over the last two years have led to strong returns for some but come with high risk for those buying and selling cattle.
  • Margins over the four analysed periods varied by over £412/head, from making a profit of over £217/head to a loss of £196/head.
  • Understanding production costs and being flexible to market conditions are vital to making a margin in a volatile market.

Store price volatility

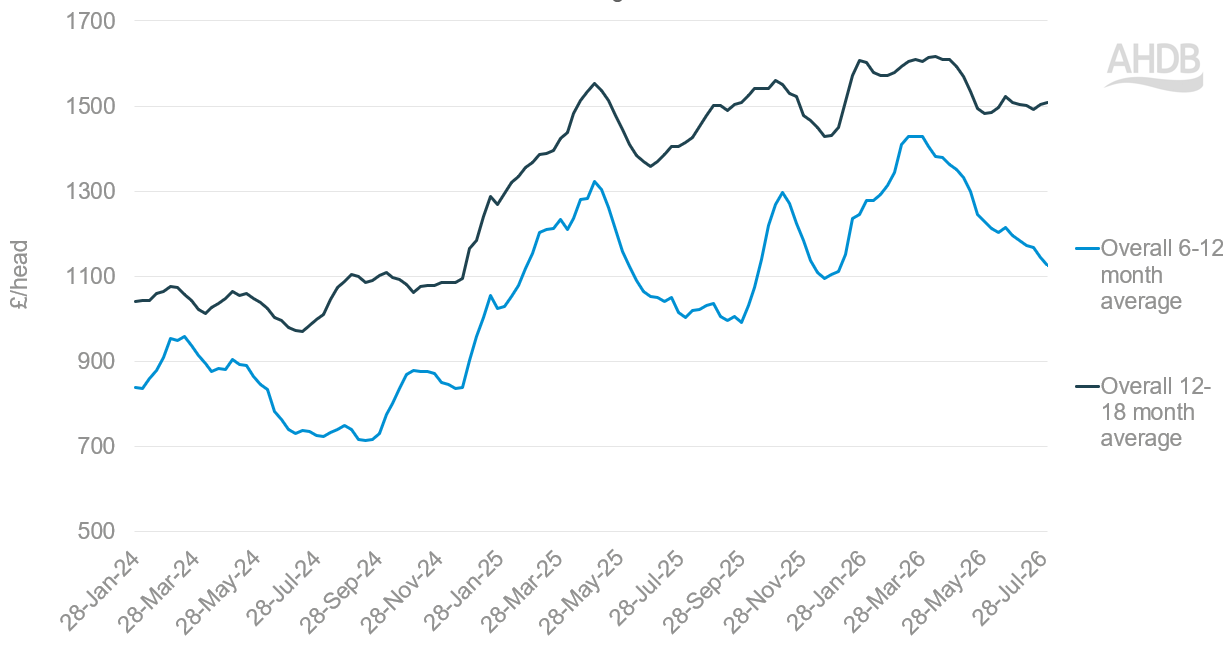
Over the last three years, store cattle prices have been exceptionally volatile. Average prices for 6–12 month-old store cattle in England and Wales have ranged from £714/head to £1429/head, while prices for 12–18-month-old cattle have ranged from £970/head to £1,615/head1.

Price fluctuations come as result of multiple reasons affecting supply and demand, including softening consumer demand, tightening cattle supply and changes in import and export volumes.

Volatile cattle prices have created opportunities for some producers but squeezed margins for others. For those buying-in stock, success depends on maintaining a margin between purchase costs and sale values.

Figure 1: Four-week rolling average prices for store cattle aged 6-12 months and 12-18 months old, England & Wales

  Figure 1 shows the 4-week rolling average price of store cattle in England and Wales.

Source: Livestock Auctioneers Association Limited

Figure 1 shows the 4-week rolling average price of store cattle in England and Wales between January 2024 and August 2026. The light blue line represents 6-12-month-old store cattle, while the dark blue represents 12-18-month-old store cattle.

How has this volatility affected margins on farm?

In this analysis, we have modelled a gross margin at four possible dates, to demonstrate the impact of buying and selling at different times.

Assumptions made in this analysis:

  • Purchase times: The purchasing of store cattle peaks around May and November, thus these months were chosen as purchasing times in the model.
  • Purchase and sale prices: Purchase price is calculated by taking the weighted average 6-12 month 4-week rolling store price. Sale price is calculated by taking the weighted average 12-18 month 4-week rolling store price. Prices as reported by the Livestock Auctioneers Association and cover England & Wales.
  • Duration on-farm: Store cattle are assumed to be kept in an enterprise for 7.1 months (28.5 weeks), based on the middle 50% of farms reporting into Farmbench.
  • Cost of production: The cost of production was based on the middle 50% of performers in Farmbench, with a figure of £351.20/head covering the costs over the 28.5 weeks the cattle were on farm.

Gross Margins

The examples below show that market timing can have a big impact on profitability. Across the four scenarios, gross margins range from a profit of £217/head to a loss of £196/head, despite production costs remaining unchanged. This illustrates how quickly margins can be eroded when cattle are purchased at a low point in the market cycle.

Table 1: Gross margin example for store cattle enterprise

  Scenario A (Rising market) Scenario B (Falling market) Scenario C  (Falling market) Scenario D (Static market)
Expenses
Week ending of store purchase (date of sale +28.5 weeks) W/e 3 Nov 24 - 1 June 25 W/e 2 Nov 25 - 5 June 26 W/e 3 March 24 - 6 Oct 24 W/e 2 March 25 - 5 October 25
Purchase price (299 kg) 876.58 1269.06 952.40 1154.14
Costs of production (feed, bedding, vet med etc) 351.20 351.20 351.20 351.20
Total costs 1227.79 1620.26 1303.60 1505.34
 Revenue        
Sale Price (447 kg) 1444.37 1483.71 1107.66 1524.59
 Total        
Gross Margin/head 216.59 -136.56 -195.95 19.25

 Source: AHDB Farmbench, Livestock Auctioneers Association Limited.

Table 1 shows a simplified gross margin at four time periods from 2024-2026, and the effect on the margin per head of cattle that the volatility in the price can have. 

Impact of market timing on profitability

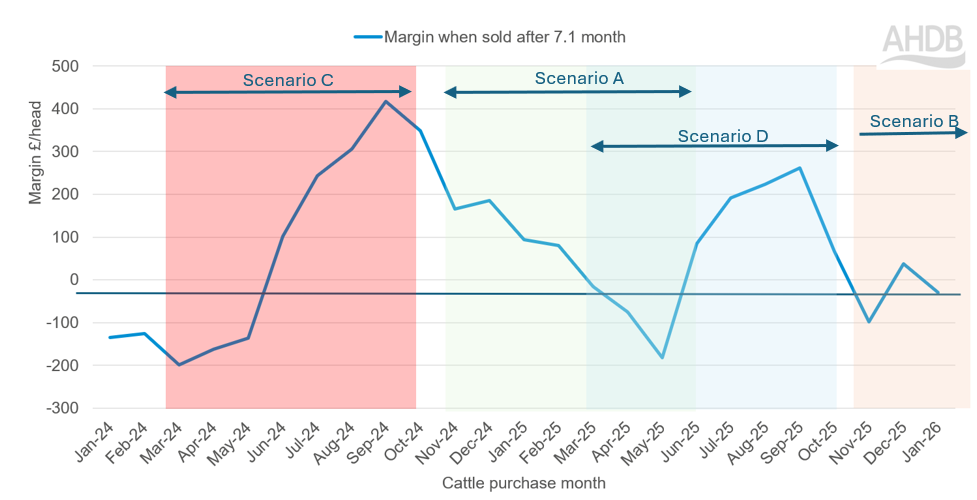
Scenario A (green shaded area on Figure 2) shows a rising market, where store cattle were purchased in November 2024 for £877/head and sold in June 2025 for £1,444/head. During their time on farm, market prices rose substantially, resulting in a gross margin of £217/head. Producers buying cattle in late 2024 benefited from entering the market before the sharp rise in store cattle prices seen during 2025.

Scenario B (orange shaded area on Figure 2) demonstrates a falling market, where cattle purchased at the market peak in November 2025 cost £1,269/head. Although the animals sold for a higher absolute value (£1,484/head) than in Scenario A, the increase in sale price was insufficient to cover the higher purchase cost and the costs incurred in rearing the animals, resulting in a loss of £137/head.

Scenario C (red shaded area on Figure 2) demonstrates another falling market. Cattle were purchased for £952/head, but market conditions deteriorated sharply before sale, reducing the sale value to £1,108/head. Despite a relatively modest purchase cost, the decline in cattle prices resulted in a gross margin loss of £196/head. This shows that even cattle bought at reasonable values can become unprofitable if the selling market weakens significantly.

Scenario D (blue shaded area on Figure 2) shows a situation where incurred costs of production are covered, but little profit is made. Where purchase and sale values remained relatively stable, cattle purchased for £1,154/head and sold for £1,525/head generated only a modest gross margin of £19/head. This suggests that when market movements are limited, farms rely heavily on technical performance, feed efficiency and tight cost control to remain profitable.

The results highlight that buying cattle at the right price can be just as important as producing them efficiently. While finishers have some control over growth rates, feed conversion and mortality, they have little influence over market movements.

Figure 2: Store cattle gross margin in £ per head 2024-20262

Figure 2 is a line chart showing the gross margin per head.

Source: AHDB Farmbench, Livestock Auctioneers Association Limited.

Figure 2 is a line chart showing the gross margin per head, using the same method as the table above but for each month from 2024-2025. The shaded areas represent the time period of each scenario (green A, orange B, red C, and blue D).

Ways to mitigate against price volatility

With little control over the prices of store cattle, there are several ways that cattle producers can help to maintain margins. There are several characteristics of top performing beef farms. These include:

  • Budget – know the maximum price you can buy cattle for and your cost of production that leaves a margin at the end, and only buy up to this budget
  • Control costs of production – reducing costs be those variable or fixed costs, reduces the pressure on the margins
  • Spread purchasing risk - buying cattle throughout the year rather than in one batch reduces exposure to market peaks and troughs
  • Focus on kilograms produced and weigh regularly - in volatile markets, focusing on the cost of producing each kilogram of liveweight/£ of input costs rather than simply chasing headline cattle prices
  • Monitor market prices closely - be flexible in buying and selling periods, and benchmark against other businesses
  • Maintain flexibility - where possible, systems that allow flexibility in cases of disease or around the timing that cattle can be sold can reduce exposure to adverse market movements
  • Consider age and weight of purchased stores - animals at a lighter weight and younger age might have a lower purchase value, but calculating days on farm is important when considering the cost of production.

Conclusion

Store cattle producers are particularly exposed to the volatility in prices, as there is no guarantee in the sale price at the point of purchase.

High store cattle prices do not necessarily translate into strong returns, as profitability is ultimately determined by the margin achieved between purchase and sale values. With gross margins varying by more than £412/head across the scenarios analysed, disciplined purchasing decisions are often just as important as technical performance. In a volatile market, successful stores will be those who understand their costs and remain flexible enough to respond to changing market conditions.

1 Store cattle prices in this article are weighted four-week rolling averages, calculated from data from the Livestock Auctioneers Association Limited © Livestock Auctioneers Association Limited 2026. All rights reserved.

2 These margins are estimated based on average purchase price and sale price figures for store cattle, factoring in time on-farm and a static cost of production figure of £351.20/head.

Image of staff member Molly Corbett

Molly Corbett

Analyst (Livestock)

See full bio


Sign up for regular updates

You can subscribe to receive Beef and Lamb market news straight to your inbox. Simply fill in your contact details on our online form.

Visit the Keep in touch page

While AHDB seeks to ensure that the information contained on this webpage is accurate at the time of publication, no warranty is given in respect of the information and data provided. You are responsible for how you use the information. To the maximum extent permitted by law, AHDB accepts no liability for loss, damage or injury howsoever caused or suffered (including that caused by negligence) directly or indirectly in relation to the information or data provided in this publication.

All intellectual property rights in the information and data on this webpage belong to or are licensed by AHDB. You are authorised to use such information for your internal business purposes only and you must not provide this information to any other third parties, including further publication of the information, or for commercial gain in any way whatsoever without the prior written permission of AHDB for each third party disclosure, publication or commercial arrangement. For more information, please see our Terms of Use and Privacy Notice or contact the Director of Corporate Affairs at info@ahdb.org.uk  © Agriculture and Horticulture Development Board. All rights reserved. 

×