Future trade deals: Cereals & oilseeds production systems in Australia
Tuesday, 25 May 2021
This article is the latest in a series where we have explored agricultural issues relating to a potential trade deal between the UK and Australia. Following on from the article we published looking at production trends and trade flows this article explores farm level costs of production for cereals and oilseeds.
Farm structure
Grain farms in Australia have been reducing in number but increasing in size through consolidation. A report from the Australian Bureau of Agricultural and Resource Economics and Sciences (ABARES) showed that between 2010 and 2015, the average size of farms predominantly growing grain increased from 2,510ha to 2,607ha. Most grain farms are family owned and operated.
In Australia, the dry climate means that direct drilling is mainly employed. While there is some direct drilling in the UK, a combination of ploughing, power harrowing and combi-drilling is more commonly used, (although there is increasing uptake of minimum cultivations such as direct drilling).
A key difference in terms of farm incomes in the UK and Australia is the level of government support or subsidy. An OECD report showed that government support comprised just over 2% of Australian farm revenues between 2016 and 2018. Most of this support is in the form of government funded R&D with the remainder allocated to risk management tools. In 2019/20 direct payments accounted for over 60% of total farm business income for English cereals farms, although the new English agricultural policy will gradually remove direct payments by 2028. This means that cereal farmers will need to examine their business operations carefully in order to remain profitable.
For analysis into costs of production and international benchmarking, AHDB has access to the agribenchmark network which comprises ‘typical’ farms in different countries. For this analysis, Australian farms growing cereals and oilseeds are compared with their UK counterparts. The UK farms shown are situated in the Wash area of Eastern England, Cambridgeshire, Suffolk and Scotland, with sizes ranging from 270ha to 800ha. In 2019, these farms received decoupled support between $262/ha and $293/ha. The Australian farms shown are situated in Western Australia and South Australia with sizes ranging from 2,800ha to 5,500ha. The Australian farms do not receive any subsidy payments and generally have a higher proportion of family labour than hired labour compared with the English and Scottish typical farms. (2019 data is not available due to collection of data hindered by the coronavirus pandemic.)
Wheat
Wheat is produced in most of Australia’s six states, but Western Australia and New South Wales are the largest wheat producers. Western Australia, contributes to around half of Australia’s total wheat output, with production taking place on over 4,000 farms which are between 1,000 and 15,000 hectares. For comparison, the average English farm size in 2019 was 87 hectares. Wheat is grown in rain-fed conditions, with good winter rainfall particularly favourable for yields. Soil fertility is relatively poor in Western Australia. New South Wales, on average, comprises around a quarter of the Australian wheat crop.
Over the crop years (2015/16-2019/20), UK wheat yields averaged 8.4t/ha, whereas Australian wheat yields averaged 1.9t/ha. In the past few years, prolonged drought has led to a substantial reduction in the Australian wheat crop and cash revenues have been lower as a result.
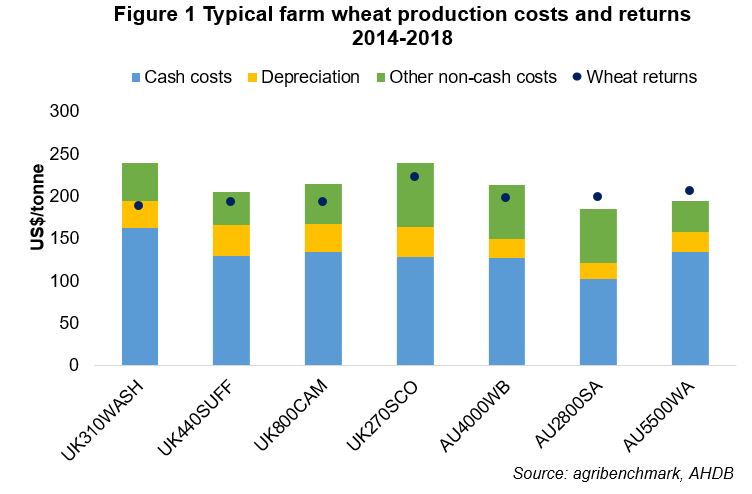
Figure 1 shows a comparison of typical UK and Australian wheat production costs and returns (2014-18 average). For the typical farms shown, the cost of producing wheat in Australia is generally lower than in the UK, with depreciation costs tending to be higher on the UK farms. To some extent, the Australian farmers likely benefit from economies of scale given that they are much larger in size. Nevertheless, there are high costs involved in getting crops to port. A report by the Australian Export Grains Innovation Centre (AEGIC) in 2018 stated that Australia’s supply chain costs were higher than those of its key competitors, with the exception of Canada.
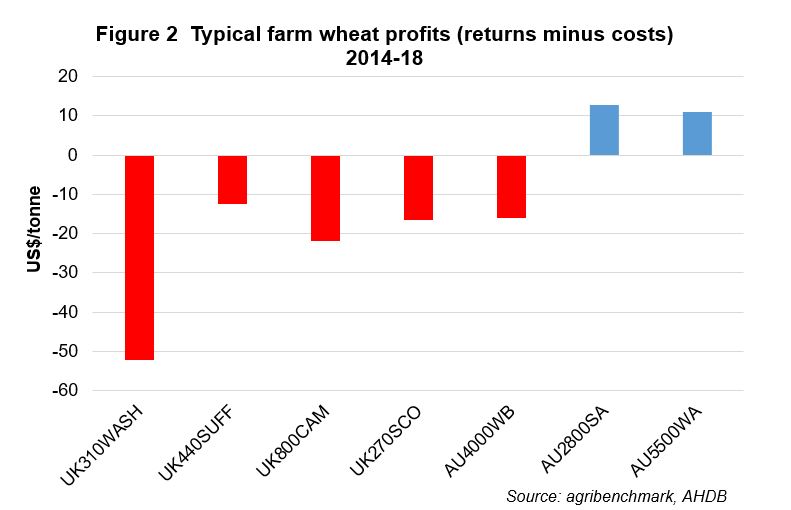
In terms of profitability on a full economic basis, all of the UK farms shown in Fig 2 made a loss over the five years 2014 to 2018, whereas most of the Australian wheat farms made a profit. This is despite the fact that drought has resulted in low Australian crop yields in the past few years which will have had an adverse impact on revenues generated.
Barley
Barley is often the second most important grain crop grown in Australia after wheat. From an agronomic perspective, barley is more tolerant of drought, frost and disease and can be grown in a wider range of conditions. The majority of barley grown in Australia is two-row cultivars which are mostly spring barley but grown as winter crops.
Western Australia is the top barley producing state in Australia, accounting for around 40% of the country’s production.
Australian barley yields averaged 2.3t/ha from 2015/16 to 2019/20, while UK barley yields averaged 6.3t/ha. Spring barley accounts for just over 60% of the UK barley crop (previous five year average).
Figure 3 shows that the typical Australian farm has lower barley production costs than those in the UK due to lower depreciation and non-cash costs. The relative size of the Australian farm, which is over 10 times larger than the UK farms shown, will be a key factor in the lower costs involved. However, it is difficult to extract further insight as data for only one Australian typical farm is available.
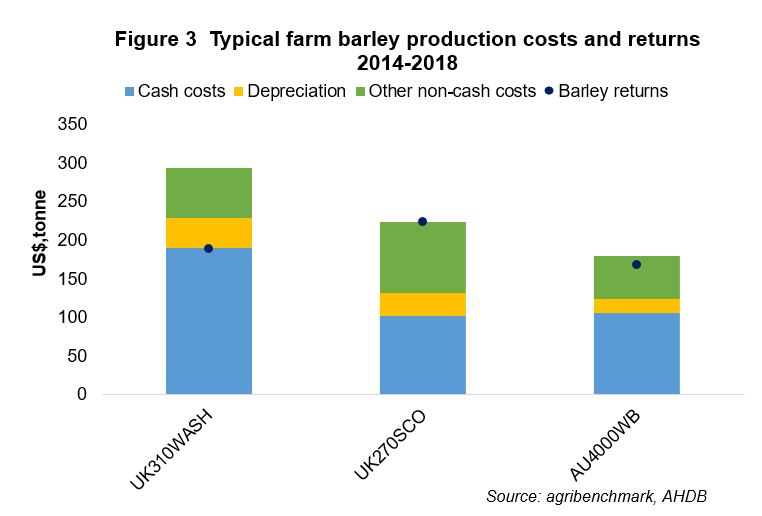
The type of barley grown will also influence costs and revenue, with malting barley commanding a premium over feed barley, but also requiring higher nitrogen applications.
Rapeseed
Rapeseed (or canola as it is called in Australia) is a fairly risky crop to grow in both the UK and Australia. The area planted to rapeseed in the UK has declined steadily since the peak in 2012 (756Kha) to a low of 380Kha in 2020. In Australia, canola plantings have remained steady, at around 2-3 million hectares, over the past ten years (with the exception of 2019/20).
As for wheat and barley, Western Australia is the largest canola (rapeseed) producing state in Australia, accounting for around 48% of the country’s total output (previous five year average).
Australian canola yields averaged 1.3t/ha (2015/16—2019/20)) compared with 3.5 t/ha in the UK. Approximately 20% of the Australian canola crop is genetically modified (GM) but growing GM canola in South Australia, the Australian Capital Territory (ACT) and Tasmania is banned.
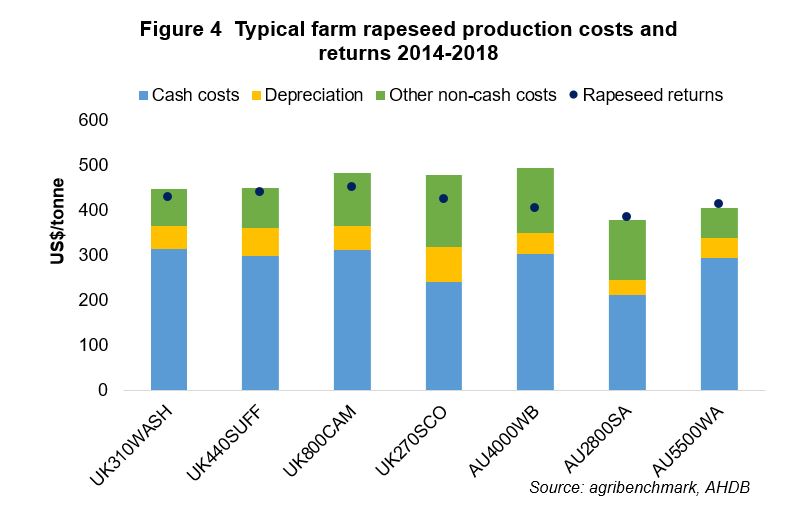
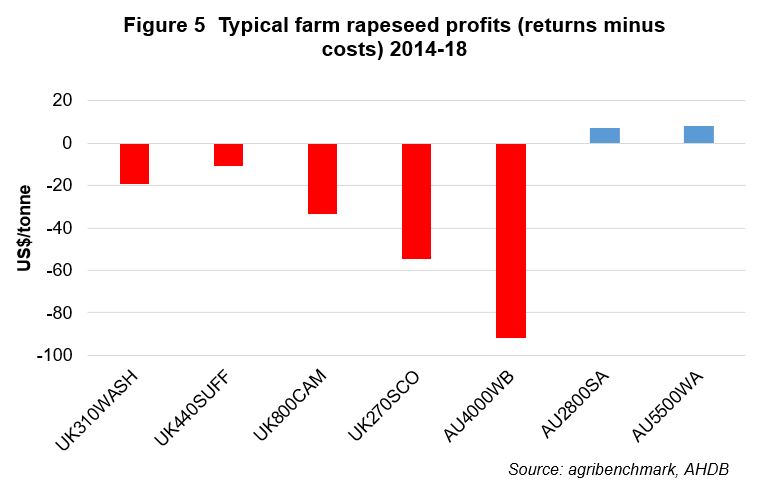
As for wheat and barley, rapeseed cost of production in Australia is lower than in the UK as shown in Figure 4. Rapeseed returns for the typical farms shown are at similar levels and so, with the exception of AU4000WB, the Australian farms growing rapeseed are more profitable than their UK counterparts (Figure 5).
An important point to remember is that although Australia’s cost of production for cereals and oilseeds is relatively lower than in the UK, there are other significant factors at play when it comes to where product is directed at a global level. In terms of trade, the UK is not a key market for Australian cereals and oilseeds as there are more lucrative and proximal markets available.


