Agricultural trade with Canada - Livestock products
Friday, 20 August 2021
As trade deals with the likes of Australia and New Zealand continue to progress, these are not the only trade deals that are currently under consideration. We already have a trade agreement with Canada, as a roll-over of the previous agreement the EU has with Canada (Known as CETA). However, as part of that agreement both sides agreed to revisit the text and negotiate ‘upgraded’ deals that better suit the two individual countries. With that in mind, in this article we take a look at some figures behind Canada’s domestic production and trading partners.
Beef
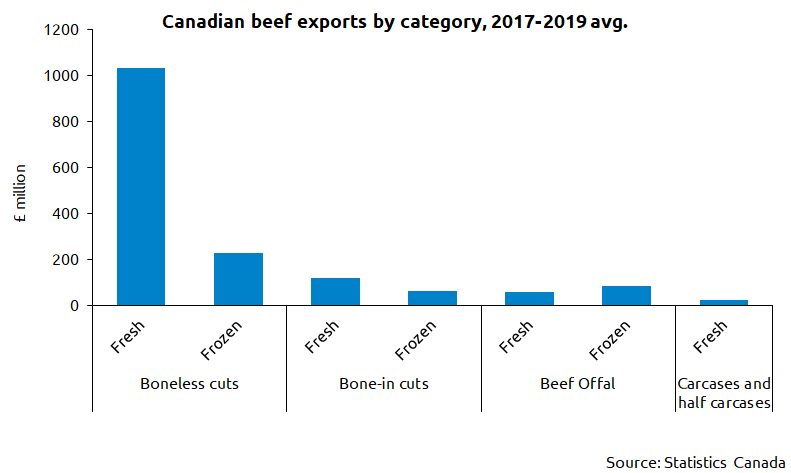
Canada has a reasonably sized beef industry, producing around 1.3 million tonnes of beef per annum. Much of this is consumed domestically, however, there is still a significant proportion of production that is exported. The main destination for Canadian beef is the United States, with over 73% of Canadian exports headed there, mainly for the grinding market as cuts of boneless beef. Other major destinations for Canadian beef are primarily Asian markets, like Japan and Hong Kong, however around £70m worth of beef also heads to Mexico each year. Despite securing a trade deal with Europe in 2017 and having access to a tariff free quota, exports of beef to the EU are limited. Canadian farmers have previously suggested that meeting the two differing standards between the EU, and their major market the US is an unprofitable exercise. There are small amounts of exports to the UK (1,300t/annum)[1].
Canada annual exports of total beef (incl. offal) to key markets, 2017–2019 average
|
Country |
Volume shipped (t) |
Value (£ million) |
Unit price (£/t) |
|
United States |
298,000 |
1,210 |
4,100 |
|
Japan |
36,000 |
143 |
4,000 |
|
Hong Kong |
20,000 |
96 |
4,900 |
|
Mexico |
16,000 |
70 |
4,200 |
|
China |
10,000 |
56 |
5,400 |
|
Source: IHS Maritime & Trade - Global Trade Atlas®, Statistics Canada |
|||
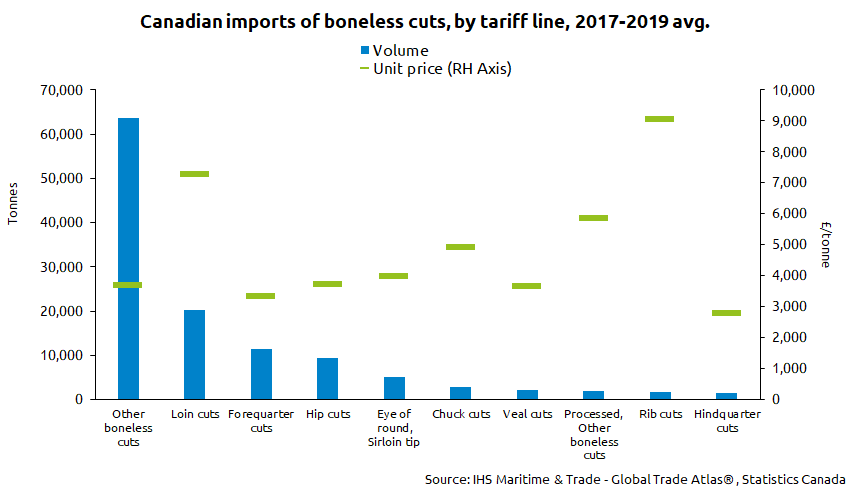
Imports of beef to Canada average around £767m per annum, mainly of fresh/frozen boneless cuts however there are significant exports of processed beef (£141m). The United States are the largest supplier of beef to the Canadian market, exporting around £547m per annum. This has likely been facilitated by long-standing free trade agreements and market access. Obviously geographical proximity will have a major effect on trade between the two countries. Behind the US, Australia and NZ are the next largest suppliers, exporting £71m and £60m per annum respectively. In terms of unit prices, UK exports of beef generally benchmark around the same price as what Australia are currently exporting to Canada at around £3,700t.
[1] Data is from a period when UK was part of the EU
|
Annual production and trade, 2017–2019 average |
||
|
|
 |
 |
|
PRODUCTION (3-yr avg) |
1.3 million tonnes |
906,000 tonnes (cwt) |
|
TOTAL EXPORTS (3-yr avg) |
406,000 tonnes |
171,000 tonnes |
|
TOTAL IMPORTS (3-yr avg) |
168,000 tonnes |
362,000 tonnes |
|
Source: Defra, HMRC, IHS Maritime & Trade - Global Trade Atlas®, FAOStat, Statistics Canada |
||
Sheep meat
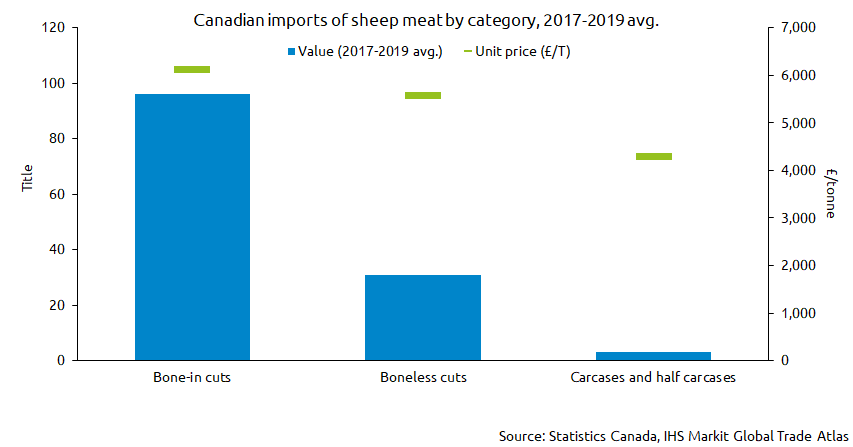
Both sheep production, and demand for sheep meat in Canada are relatively low. Per capita sheep meat consumption is around 0.9kg. Predation by wild animals such as coyotes, wolves and bears prevent keeping sheep in many parts of the country. Despite a relatively low level of consumption, Canada still imports around 22,000 tonnes of sheep meat per annum. The primary suppliers of lamb to the Canadian market are Australia and New Zealand, with Ireland also supplying a small amount per year (1,000t).
|
Annual production and trade, 2017–2019 average |
||
|
|
 |
 |
|
PRODUCTION (3-yr avg) |
16,000 tonnes |
299,000 tonnes (cwt) |
|
TOTAL EXPORTS (3-yr avg) |
N/A |
95,000 tonnes |
|
TOTAL IMPORTS (3-yr avg) |
22,000 tonnes |
83,000 tonnes |
|
Source: Defra, HMRC, IHS Maritime & Trade - Global Trade Atlas®, FAOStat, Statistics Canada |
||
Pork
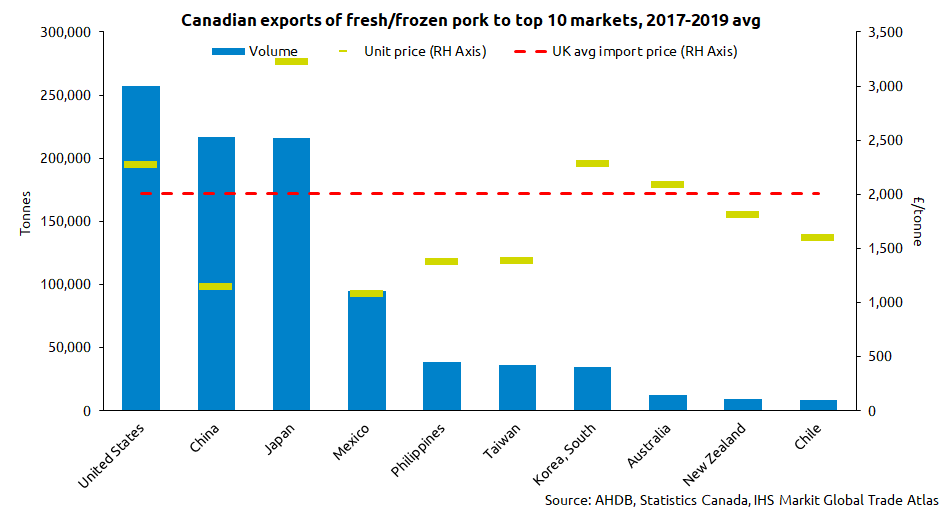
The pork industry in Canada is one of the largest of the agricultural commodity sectors operating in the country. With over 7,000 pigs farms currently operating, producing around 2.1 million tonnes of pork each year. Domestic consumption is reasonable, however over 50% of production is exported each year to a variety of markets. The top destination for Canadian exports is the United States, however this is followed closely behind by Japan, who import around 235,000 tonnes of Canadian pork each year.
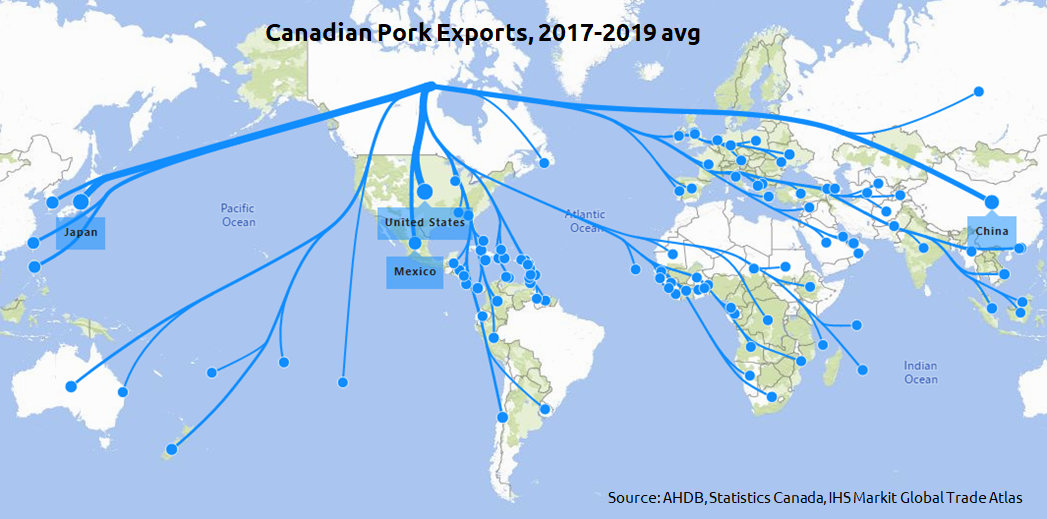
The vast majority of exports consist of fresh/frozen pork, as opposed to hams, bacon or sausages for example. In terms of fresh/frozen pork, average export prices from Canada were around £2,000/t between 2017-2019; similar to the average import price of pork products imported into the UK. However, there is a more variation in the Canadian export price, depending on the market, and to certain markets Canada are extremely competitive. Currently there is a negligible amount of pork exported from Canada to the UK, or even to the wider European Union market place, despite a free trade agreement between the two being signed, highlighting the fact that often a trade deal doesn’t necessarily lead to an increase in trade of particular products.
Although Canada is a fairly large producer and exporter of pork, around 243,000 tonnes of pork is imported each year (2017-2019 avg.). The vast majority of this comes from the United States, which is most likely in part due to circular trade between the two countries with product passing back and forth for processing sides either side of the border. There is also significant live trade in pigs between the two countries. Aside from the United States, Canada imports 23,000t on average (2017-19) from the EU, the vast majority of this is fresh/frozen pork.
|
Annual production and trade, 2017–2019 average |
||
|
|
 |
 |
|
PRODUCTION (3-yr avg) |
2.1 million tonnes |
930,000 tonnes |
|
TOTAL EXPORTS (3-yr avg) |
1.2 million tonnes |
353,000 tonnes |
|
TOTAL IMPORTS (3 yr-avg) |
243,000 tonnes |
966,000 tonnes |
|
Source: Defra, HMRC, IHS Maritime & Trade - Global Trade Atlas®, FAOStat, Statistics Canada |
||
Dairy products
The dairy industry in Canada is relatively large and is heavily managed by provincial milk marketing boards, which set the price for domestically produced milk. This varies from province to province and different prices will be set for milk destined for different processing outputs, however all farmers in the same province will receive the same price for similar quality milk. The price is typically reviewed once a year and an adjustment is made based on the cost of production (50% of the adjustment) and consumer price index (50% of the adjustment and a measure of inflation).
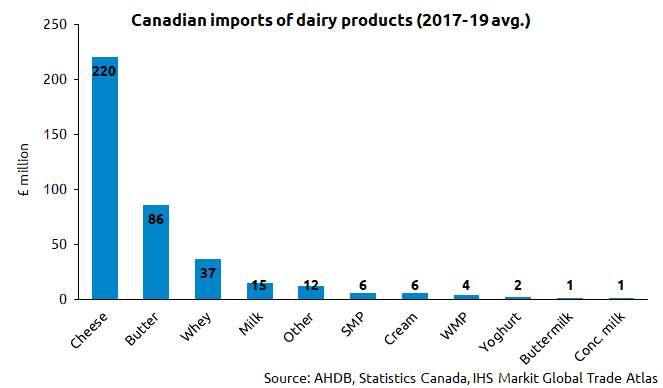
Canada imports a variety of dairy products, predominately cheese and butter by value. The major supplier of dairy products is the United States, supplying around £161m of products per annum (2017-19 avg.). A number of European suppliers export reasonable amounts of cheese to the Canadian market, with Italy actually the leading supplier of cheese on a 3 year average basis (£54m). France also supplies around £38m with the United Kingdom sending around £11m worth of cheese per year. Canada also imports a significant amount of butter each yeah, with the US and NZ the predominant suppliers.
Like with much of Canadian trade, the predominant market for dairy exports is the United States, with £99m out of a total £239m dairy exports, heading to the US. The predominant export by category is skim milk powder, however, unlike other dairy products, not much is exported to the US. In this category African markets like Egypt and Algeria are key export markets. However, exports in skim milk powder is fairly diversified across Asia and other parts of the world, although total exports are relatively small compared to other major dairy exporters.
|
Annual production and trade, 2017–2019 average |
||
|
|
 |
 |
|
PRODUCTION (3-yr avg) |
Liquid Milk: 9.8m tonnes Butter: 112,000 tonnes Cheese: 507,000 tonnes |
Liquid milk: 6.7m tonnes Butter: 167,000 tonnes Cheese: 461,000 tonnes |
|
TOTAL EXPORTS (3-yr avg)
|
£239m Top exports: 1. SMP - £89m
|
£1.66bn Top exports: 1. Cheese - £666m |
|
TOTAL IMPORTS (3-yr avg) |
£390m Top imports: 1. Cheese - £220m |
£2.86bn Top imports: 1. Cheese - £1.7bn |
|
Source: Defra, HMRC, IHS Maritime & Trade - Global Trade Atlas®, USDA FAS, Statistics Canada |
||

Topics:
Sectors:
Tags:

