- Home
- Stacking options for SFI 2023: Arable
Stacking options for SFI 2023: Arable
Applications for the Sustainable Farming Incentive (SFI) 2023 opened on 18 September 2023. We calculated the likely effect on arable farm profit levels of stacking SFI and Countryside Stewardship (CS) actions over a three-year period.
See our stacking analysis on two other sectors:
Main findings
- The SFI alone is not going to be enough to mitigate the loss of Direct Payments – this is an intentional design of the scheme. But the right combination of actions could make up a considerable amount of the shortfall
- Taking part in the SFI can provide substantial extra income for arable farm businesses
- If farmers carefully select SFI and Countryside Stewardship (CS) actions that are right for their farm, they can boost the farm’s net profit level
- If actions can be carried out on unproductive areas of the farm without sacrificing the area of cash crops, an increase in net profit is likely; such actions are also likely to help regenerate unproductive land and make it more productive in the long term
- Farmers have the opportunity to maximise the potential of every hectare of land on their farm
- The SFI has a greater impact on farms with low gross profit margins compared with those that have high gross profit margins
- For all farms, the financial benefit of taking part in the SFI is most likely to be felt in years where crop prices are average or below average; it can act as buffer in lean years
- Looking ahead, the SFI can play a role in stabilising farm business incomes
The three stacking options: A, B and C
Our analysis considers three ways of stacking actions:
- Option A: SFI ‘lite’ – a combination of SFI actions which do not require additional land
- Option B: SFI ‘ambitious’ – option A plus a combination of SFI actions which require additional land
- Option C: SFI and CS – option B plus specific CS actions
Table 1 shows which actions were included in options A to C, along with payment rate and the area of the virtual farm selected for each action.
Note: The table shows current actions available; more will be funded as the scheme progresses.
Updated 9 January 2024 to reflect changes in payment rates.
A further update is planned by Spring 2024 to add 2023 data.
Table 1. SFI and CS actions under Options A to C with payment rates and area of land
| Code | Action | Payment | Area or length | |
|---|---|---|---|---|
| Option A | SAM1 | Assess soil, test soil organic matter (SOM), produce soil management plan | £6.00/ha plus £97 per agreement | 107 ha |
| SAM2 | Multi-species winter cover crop | £129/ha | 21.4 ha | |
| HRW1 | Assess and record hedgerow condition | £5 per 100m – one side | 23,200 m | |
| HRW2 | Manage hedgerows | £13 per 100m – one side | 23,200 m | |
|
HRW3 |
Maintain or establish hedgerow trees | £10 per 100m – both sides | 23,200 m | |
| IPM1 | Assess integrated pest management and produce a plan | £1,129 per year | n/a | |
| IPM3 | Companion crop on arable land | £55/ha | 20 ha | |
| IPM4 | No use of insecticide on arable crops and permanent crops | £45/ha | 67.5 ha | |
| NUM1 | Assess nutrient management and produce a plan | £652 per year | n/a | |
|
Option B |
IPM2 | Flower-rich grass margins, blocks or in-field strips | £798/ha | 10 ha |
| NUM3 | Legume fallow | £593/ha | 5 ha | |
| AHL1 | Pollen and nectar flower mix | £764/ha | 5 ha | |
| AHL2 | Winter bird food on arable and horticultural land | £853/ha | 10 ha | |
| AHL3 | Grassy field corners and blocks | £590/ha | 5 ha | |
| AHL4 | 4m to 12m grass buffer strip on arable and horticultural land | £515/ha | 0.9 ha | |
| Option C All actions listed for Options A and B, plus: |
AB7 | Whole crop cereals | £596/ha | 15 ha |
| WD3 | Woodland edges on arable land | £428/ha | 1 ha | |
| BE1 | Protection of in-field trees on arable land | £553/ha | 0.12 ha |
Source: Defra, AHDB
An SFI management payment is also available, which is £20/ha up to the first 50 hectares of land entered into the relevant SFI actions. This has been factored into the analysis: the virtual 455 ha arable farm receives the maximum SFI management payment of £1,000 per year.
The baseline year
Our analysis used 2022 as the baseline year, as this is the most recent year for which there is a full set of annual data. Later though, under ‘Market prices can have a big effect’, we look at the difference made to net profit levels using 2019–2021 average crop prices.
Methodology
For this analysis, we used our 455 ha arable virtual farm. The AHDB virtual farms are theoretical farms that exist on a spreadsheet but are designed to be representative of ‘typical farms’. They have been created as middle 50%-performing businesses: this means that their performance is comparable to actual national or regional averages. The costs associated with these middle-performing farms also tend to be higher than on farms in the top 25%, and these costs have been cross-referenced to average results from the Farm Business Survey.
The arable virtual farm used in this analysis
- Located in the East of England
- 450 ha of farming land
- 5 ha of land allocated to woodland, buildings and roads
Detailed description of the arable virtual farm
The analysis used 2022 as the baseline year, as this is the most recent year for which there is a full set of annual data. We looked at the difference made to net profit levels using the 2019–2021 average crop prices in the section ‘Market prices can have a big effect’.
We allocated different areas of the farm to the individual actions under each option and calculated the cost of carrying out each of the SFI actions on that area. This provided a net payment for each SFI action.
Net payments were calculated for each of the three years of the SFI agreement, taking into account that one-off costs and annual costs were incurred, depending on the action.
To examine the effect on the farm of taking part in the SFI, all other variables – such as prices and yields – were kept constant over the three-year duration of the SFI agreement). The net payments were incorporated into the virtual farm’s balance sheets to calculate the net profit (total revenue minus total costs) for a given year. The change in the farm’s net profit in taking part in the SFI compared with not taking part in the SFI was then calculated.
Option A impact on profits
What’s the overall impact of option A on the farm’s net profit?
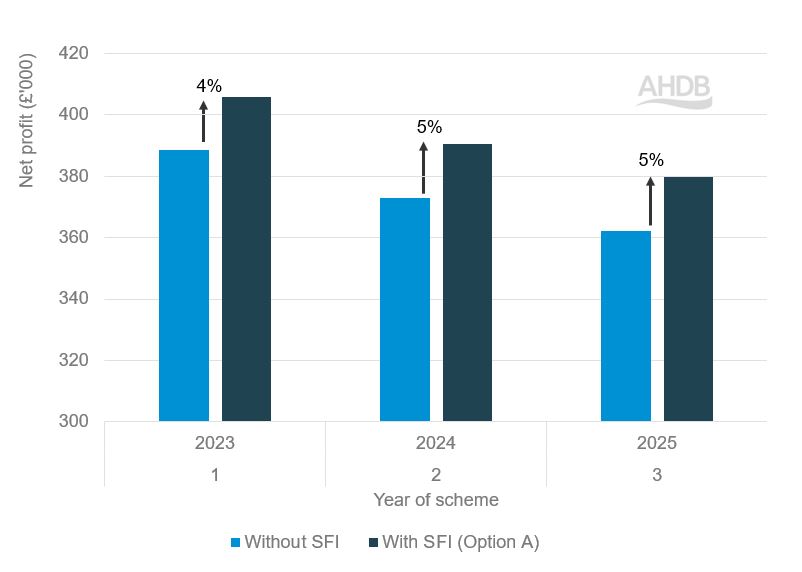
Figure 1 shows that the net profit (total revenue minus total cost) of the farm increases by 4% in year 1 of the agreement and by 5% in years 2 and 3.
Figure 1. Effect on 455 ha arable farm’s net profit level – option A
Source: AHDB
The gross profit of the 455 ha arable farm (using 2022 as a baseline) is £1,646/ha. If the gross profit was around £900/ha, the farm’s net profit would increase by 31% in year 1, 47% in year 2 and 71% in year 3.
The impact of the SFI is greater on farm businesses with low gross profit margins than those with high gross profit margins.
How much money can the farm make from option A (SFI ‘lite’)?
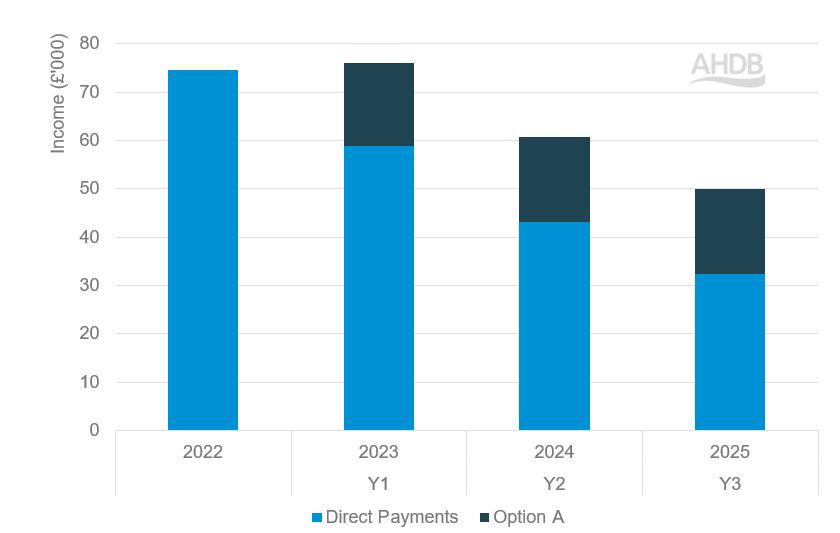
Figure 2 shows the income that would be received by AHDB’s 455 ha arable virtual farm if option A was selected.
Figure 2. Three-year projection of income received by a 455 ha arable farm from Direct Payments and SFI actions – option A
Source: AHDB
See a breakdown of SFI payments with option A
As a result of carrying out the actions under option A, the farm receives an extra £17,000 on average per year over the three-year duration of the SFI agreement. While this does not fill the gap left by reduction of Direct Payments, it enables the farm business to be £15,000 better off than it would have been without SFI.
Option A, therefore, provides the 455 ha arable farm with £17,000 additional income and up to 5% increase in net profit over the three years of the scheme and does not require any major changes to be made to the farm’s set-up.
Option B impact on profits
What’s the overall impact of option B on the farm’s net profit?
The more ambitious SFI actions require land and can potentially alter the set-up of the farm. To carry out the ambitious actions in option B, 36 ha of land was selected, which equates to 8% of the farmland available. We will now look at two extremes: one where the 455 ha arable farm has an area of unproductive land and one where it does not.
Unproductive land
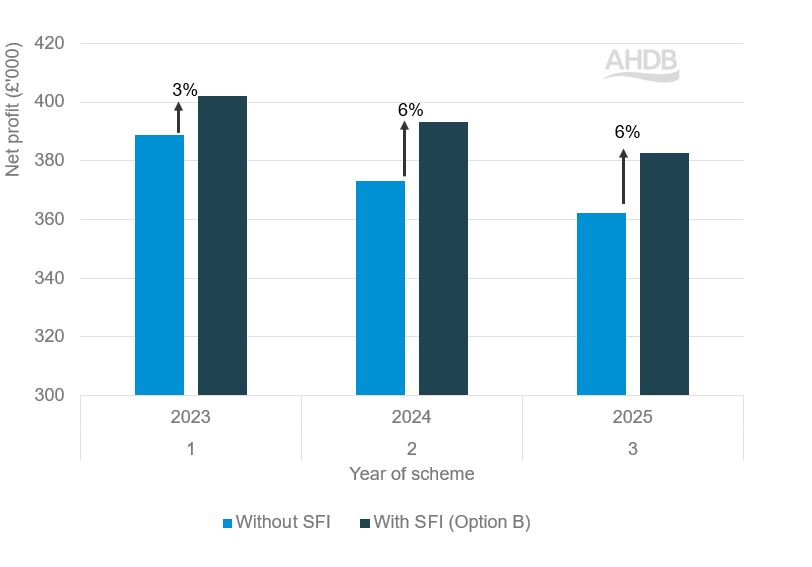
If the 455 ha arable farm has one or two unproductive fields, on which most of the SFI actions in option B can be allocated, the change in the farm’s net profit increases by 3–6% over the three years (Figure 3).
Figure 3. Effect on 455 ha arable farm’s net profit level after implementing option B on unproductive fields
Source: AHDB
The percentage changes shown in Figure 3 are based on a gross profit level of £1,646/ha. If the farm had a gross profit level of £900/ha, the percentage changes in years 1, 2 and 3 would be 51%, 98% and 148%, respectively.
Productive land
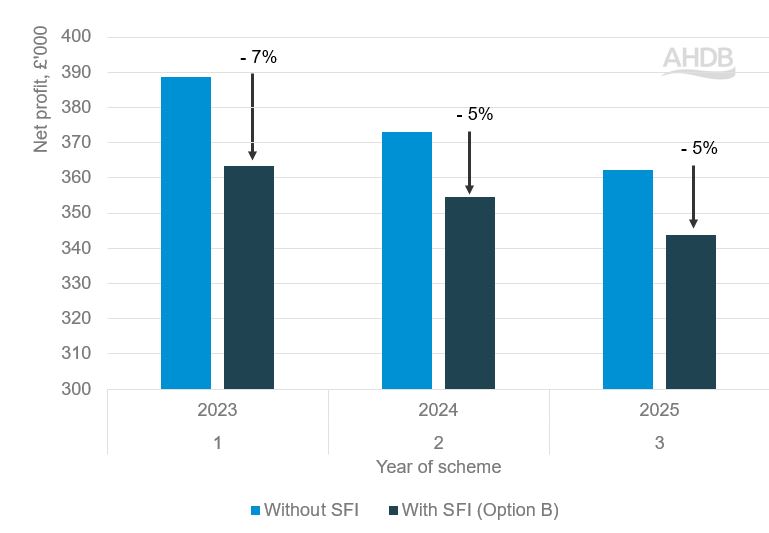
If, however, the actions under option B can only be carried out by taking productive land out of production (i.e. reducing the area of cash crops to make way for environmental mixes), the net profit of the farm declines, as shown in Figure 4.
Figure 4. Effect on 455 ha arable farm’s net profit level after implementing option B by sacrificing productive land
Source: AHDB
For a farm with a lower gross profit (£1,646/ha) than the 455 ha arable farm, these losses would be greater in percentage terms and, thus, more detrimental to the farm business.
Carrying out the more environmentally ambitious actions is likely to benefit the productivity of farmland in the longer term. But farmers are unlikely to see immediate financial returns if they can only be accommodated by reducing the area of cash crops or by more profitable enterprises.
How much money can the farm make from option B (SFI ‘ambitious’)?
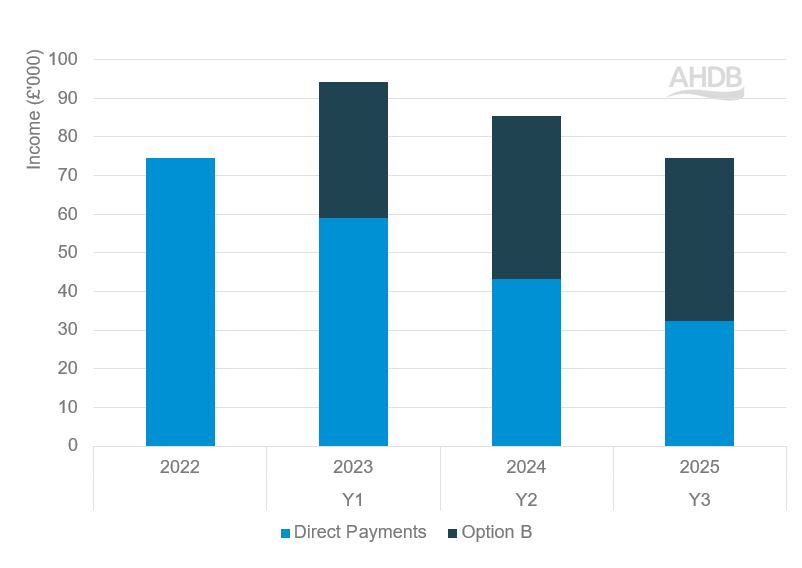
The additional income the farm receives if it selects actions listed for option B is £35,000–£42,000, as shown in Figure 5.
Figure 5. Three-year projection of income received by 455 ha arable farm from Direct Payments and SFI actions – option B
Source: AHDB
See the breakdown of SFI payments with option B
The income from SFI in year 1 is lower than in years 2 and 3 for some actions, such as IPM2 (flower-rich grass margins, blocks or in-field strips) and AHL1 (pollen and nectar flower mix), because there is an establishment cost in the first year.
In year 3, the farm receives more income from the SFI actions under option B than it does from Direct Payments. This highlights the advantage of the more ambitious approach of option B over option A: higher payments are received for more ambitious environmental actions.
Option C impact on profits
What’s the overall impact of option C on the farm’s net profit?
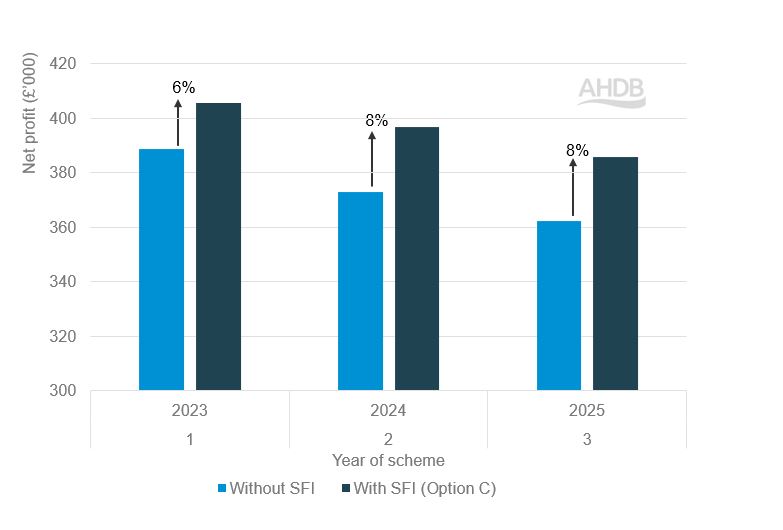
The CS options included in option C were chosen on the basis that they would require no additional land to implement on the farm. As a result, the impact on the farm’s net profit level is positive (Figure 6).
Figure 6. Effect on 455 ha arable farm’s net profit level after implementing option C
Source: AHDB
As mentioned previously, the gross profit of the 455 ha arable farm, using the 2022 baseline, is £1,646/ha. If the farm’s gross profit was £900/ha, the net profit of the farm would increase by 71%, 127% and 192%, respectively, by selecting option C.
If additional land was taken out of production to accommodate CS options, the net profit of the farm would be less than that shown in Figure 6 depending on the amount of extra land required. This demonstrates the need to carefully consider which actions are worthwhile.
Although some SFI and CS actions have the same objective and payment rate, they may have different requirements in terms of timings, and whether the area of land can be grazed, for example.
For this reason, it’s important to read all the associated details to determine which scheme best suits your farm.
How much money can the farm make from option C (SFI and CS)?
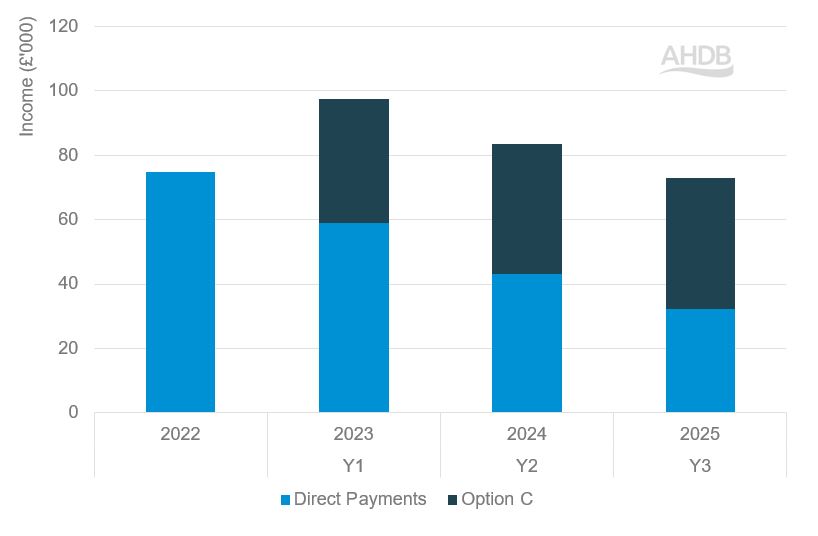
The additional income the farm can receive by carrying out option C is shown in Figure 7. While SFI and CS actions can both be carried out on farm, farmers will not be paid twice to carry out equivalent SFI and CS options on the same parcel of land.
Figure 7. Three-year projection of income received by 455 ha arable farm from Direct Payments and SFI actions – option C
Source: AHDB
See the breakdown of SFI payments with option C
By selecting option C, the farm receives between £45,000 and £46,000 as additional income over the three-year SFI agreement. In years 2 and 3, the income from SFI actions is higher than the amount received from Direct Payments.
Market prices can have a big effect
Our analysis of the effects of selecting options A, B and C was carried out using 2022 as the baseline year – as this is the year with the most recent data. But market prices in 2022 were higher than average – so the net profit of the farm, as well as the opportunity cost of taking land out of production, will be inflated relative to an average year.
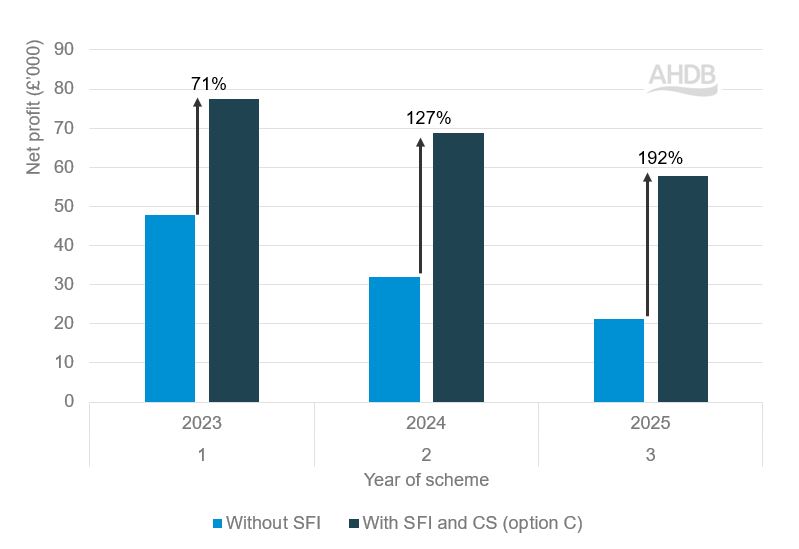
Figure 8 shows the change in the net profit of the 455 ha arable farm if option C was selected and average crop prices (2019–2021) were used.
Figure 8. Effect of 455 ha arable farm’s net profit level after implementing option C at average (2019–2021) crop prices
Source: AHDB
The additional income the farm receives from undertaking option C actions is the same as in Figure 7, but in a time of lower profit margins, it comprises a larger proportion of the farm’s net profit. This demonstrates how, in leaner years, the overall impact of taking part in environmental schemes like SFI and CS is much greater and can provide a buffer for farm businesses in testing circumstances.
The same argument is valid for the gross profit of the farm, as seen above. Percentage increases will be amplified for farms with lower gross profit levels compared with farms with higher gross profit levels.
Conclusions
The 455 ha arable virtual farm in this analysis received between £17,000 and £46,000 in additional income, depending on whether actions under options A, B or C were undertaken. The more ambitious the actions selected, the higher the extra revenue.
More ambitious actions require additional land; however, if the area where cash crops grow has to be compromised to make space for agri-environmental options, net profit levels are likely to suffer.
If actions can be carried out on unproductive areas of the farm without sacrificing the area of cash crops, an increase in net profit is likely. Such actions may also help regenerate unproductive land and make it more productive in the long term.
Another option to explore is replacing unprofitable break crops with options such as SAM3 (herbal ley). At a payment rate of £382/ha, this may prove to be considerably more profitable than oilseed rape, for example, not only in terms of market price but also the associated challenges of growing the crop. We will investigate this in more detail and publish a further analysis at a later date.
The 2023 update of the SFI scheme offers farmers much more flexibility in terms of choosing actions which suit their farms, but only careful planning and selection will ensure each farmer benefits economically in their particular situation.
It is not just the financials that are affected, but also practicalities: for some SFI and CS actions, payment rates are identical, and you can’t be paid for both to be carried out on the same parcel of land – but different restrictions apply to SFI and CS actions. It is best to read into the details provided in Defra’s 2023 guidance: SFI Handbook for the SFI 2023 offer.
No single action in the SFI or CS is going to be enough to mitigate the loss of Direct Payments, but the right combination of actions could go a long way to make up some of the shortfall. This will be more pronounced and helpful to farm businesses in years of average or low crop prices rather than in years in which prices are high. Similarly, farm businesses with lower gross profit levels will benefit more from the SFI than businesses with higher gross profit levels. The SFI will have a role in stabilising farm incomes, as has been the case for Direct Payments and the wider Basic Payment Scheme. Gains from the SFI will be amplified in low/average cost years and for businesses with low gross profit levels. But, if a loss is made, that too will be amplified under these conditions. This highlights the importance of choosing actions with care and making the best plan for your farm.
It is worth remembering that more SFI actions will be made available to farmers as the scheme progresses, providing more choice and sources of income.
With applications now open for SFI 2023, it is in farmers’ interest to investigate which options work for their farm and make the best-informed decision about their business.
Useful links
Sustainable Farming Incentive (SFI)
Environmental Land Management Schemes
Preparing for change: The characteristics of top performing farms
Farmbench: A farm business comparison tool
Relevant AHDB monitor farm meetings (December 2023 & January 2024)
Norwich Monitor Farm: Carbon audits, baselining and income optimisation from SFI
Chathill Monitor Farm: Stacking ecosystem goods and services: Putting theory into practice
Wolverhampton Monitor Farm: Make the most of SFI
Wainfleet Monitor Farm: Which break crop?
Ripon Monitor Farm: Stacking ecosystem goods and services: Putting theory into practice
Newbury Monitor Farm: Saving costs with a Lean review and SFI update for spring 2024
All Cereal & Oilseeds winter events November to March 2023

