UN gives pathways towards lower livestock emissions
Monday, 12 February 2024
In brief:
The United Nations Food and Agriculture Organisation (FAO) has recently published two reports relevant to livestock emissions. These reports show:
- Global demand for livestock products is expected to increase. Livestock is part of the plan to deliver zero human hunger, while limiting global temperature rise to 1.5°C
- There can be significant gains by supplying the additional products and/or knowledge from more efficient areas of the globe, such as the UK
- Improved genetics and animal health and welfare are also critical focus areas
- Recognition that carbon sequestration is part of the solution
Global demand for animal products to increase
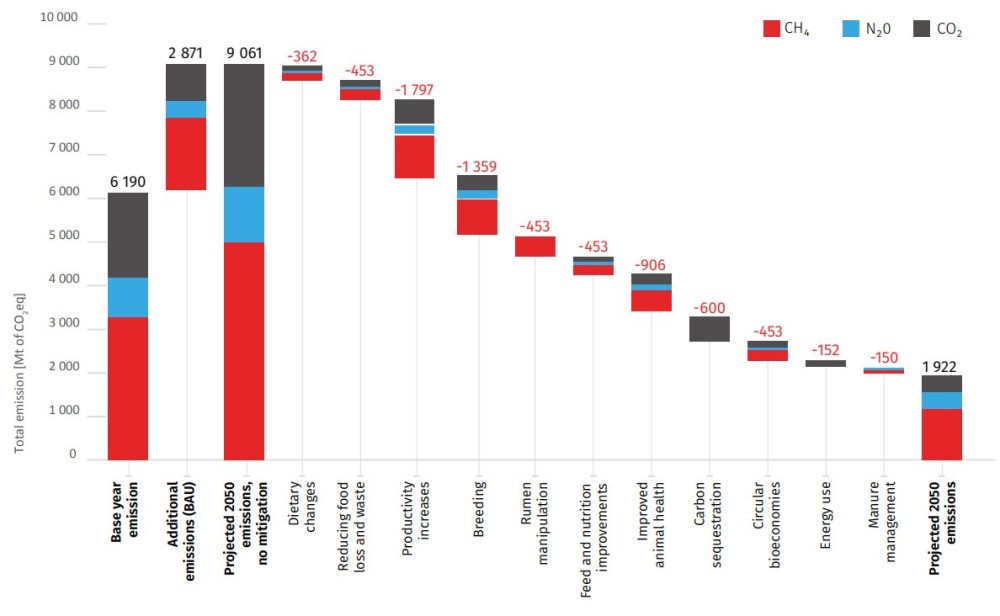
It is predicted that there will be a 20% increase in worldwide demand for animal products between 2020 and 2050, driven by a growing and more affluent global population, according to a recent FAO[1] report. If “business as usual” is maintained, this growth will be accompanied by a nearly 50% rise in emissions[2]. However, total livestock emissions could be significantly reduced instead if a wide range of mitigation measures is adopted – while still meeting the increased global demand for animal products. This also ties into the UN’s goal to achieve zero global hunger while limiting global temperature rise to 1.5°C.
The FAO published its “Pathways towards lower emissions” report as part of COP28. The report’s results show cattle contributes over 60% of global livestock emissions, of which enteric methane and manure are significant contributors. However, FAO uses GWP100 to measure greenhouse gas (GHG) emissions (and did not include sequestration in its calculations). The short lifespan of methane is acknowledged, but reducing methane emissions was still considered highly important, as sufficient reductions could prevent going above 2°C of warming.
Mitigation practices – Ways to reduce GHG emissions
The potential impact of a range of mitigation measures was assessed, as summarised in the graph below. The largest improvements would come from productivity increases and breeding, which developing countries have the most to gain from but can still be a win-win improvement for many UK farms. As well as on-farm emission reductions, the bigger picture is also considered, with carbon sequestration, using livestock in circular bioeconomies, as well as reducing food loss and waste.
Figure 1. Predicted livestock emissions and potential reductions from mitigation practices
 FAO
FAO
Source: FAO, 2023. Pathways towards lower emissions – A global assessment of the greenhouse gas emissions and mitigation options from livestock agrifood systems. Rome.
It should be noted that the results modelled assume a 100% uptake in mitigation practices and that the use of one mitigation will not impact the effectiveness of another. Nevertheless, this shows the potential to significantly reduce global livestock emissions.
UN roadmap targets for agriculture
In addition to the pathway report, a global roadmap to meet UN Sustainable Development Goal (SDG) 2 – Zero Hunger has been published: FAO COP 28 – Roadmap. This has a number of milestone targets for countries to adopt in order to achieve zero human hunger while limiting global temperature rise to 1.5°C. Table 1 details the milestones relevant to AHDB levy payers.
Table 1. Key UN zero hunger milestones
|
Domain |
Year |
Description |
|
Livestock |
2030 |
Methane emissions from the livestock sector have been reduced by 25% compared to 2020 |
|
2050 |
Total factor productivity for livestock has grown at 1.7% per year globally |
|
|
Crops |
2050 |
Total factor productivity for crops has grown by 1.5% per year globally |
|
2050 |
Total factor productivity for crops has grown by 2.3% per year for low-income countries |
|
|
Enabling healthy diets for all |
2030 |
All the countries have updated their food-based dietary guidelines to provide context-appropriate quantitative recommendations on dietary patterns |
|
2030 |
All countries have legislation restricting food advertisement targeting children |
|
|
Soil & Water |
2030 |
Achieve universal and equitable access to safe and affordable drinking water for all |
|
2040 |
10 Gt of CO2eq of additional carbon have been sequestrated in cropland and pasture soil between 2025 and 2050 |
|
|
Food Loss & Waste |
2030 |
Reduce by 50% per capita global food waste at the retail and consumer levels |
Source: UN FAO, 2023. FAO COP 28 – Roadmap
A further two versions will be published at the next two COPs.
What is AHDB doing?
Although the UN is setting out targets and pathways to reduce emissions from livestock, the value of livestock in our food system is recognised. AHDB is working both to provide farmers with the necessary support and resources and to ensure consumers, industry and policymakers recognise the full contribution of farmers to net zero. Our work includes:
- Changing the narrative to ensure net carbon includes on-farm sequestration and emissions removal (e.g. renewable energy creation)
- Calling for nationwide baselining to measure carbon stocks and emissions now, helping farmers know their own numbers so they make informed decisions and providing evidence on improvement on farm
- Working with industry to develop roadmaps to net zero and providing evidence-based guidance on the most cost-effective GHG mitigation measures for the UK
- Providing evidence on the potential for carbon sequestration on farm, above and below ground
- Dual reporting with GWP100 and GWP* while the debate around GWP* continues
- Ongoing AHDB research on animal health and welfare, as well as genetics and breeding for environmental benefit in cattle and sheep
- AHDB’s Farm Excellence network of Dairy and Beef & Lamb farms includes baselining GHG emissions through carbon audits and sharing best practice on mitigations
- Promoting healthy and balanced diets – AHDB Let’s Eat Balanced campaign launched on Monday 1 January 2024
- AHDB is part of WRAP’s Courtauld Commitment 2025

