Farmbench - Top of the crops
Friday, 5 March 2021
Its been over four years since Farmbench was launched and agriculture has experienced some extremes in seasons and weather during that time. So let us look at how the crops that are benchmarked in Farmbench, performed over the last 4 years and which returned the best margins.
AHDB has examined nearly 7,900 crop enterprise performance results in Farmbench from the 2017 to 2020 harvest years for conventionally grown combinable, potato and sugar beet crops:
- Of the combinable crops, winter wheat and oilseed rape returned the biggest margins of all the crops based on all four years in the top 25% performers
- Farmbench users confirmed that winter combinable crops are more profitable than combinable spring crops
- Apart from linseed all other top 25% performing crops produced a positive 4-year average net margin
- For the middle 50% of performers, only winter oats and wheat returned a positive margin
Yields and prices
The top 25% consistently averaged higher yields than the other performance groups. Although there is a wide range of individual enterprise results that make up each group.
4-year average - 2017 to 2020 - Yield (tonnes/ha)
|
Top 25% |
Middle 50% |
Bottom 25% |
|
|
Barley - Spring |
7.0 |
6.3 |
5.4 |
|
Barley - Winter |
8.5 |
7.6 |
6.8 |
|
Beans - Spring |
4.4 |
3.5 |
2.6 |
|
Beans - Winter |
4.2 |
3.6 |
2.9 |
|
Linseed - Mixed |
2.2 |
1.6 |
1.1 |
|
Oats - Spring |
6.7 |
5.2 |
4.7 |
|
Oats - Winter |
7.5 |
7.0 |
5.7 |
|
Oilseed Rape - Winter |
4.1 |
3.4 |
2.7 |
|
Peas - Feed - Mixed |
4.2 |
3.2 |
3.0 |
|
Potatoes - Fresh |
49.4 |
46.0 |
40.9 |
|
Potatoes - Processing |
50.1 |
41.2 |
40.0 |
|
Sugar Beet |
71.3 |
62.1 |
57.7 |
|
Wheat - Spring |
6.9 |
5.7 |
5.1 |
|
Wheat - Winter |
10.0 |
9.0 |
8.1 |
Ranking of groups is based on net margins. Net margin is crop income minus all costs including the value of unpaid labour, rental value of owned land and depreciation. Subsidies are excluded.
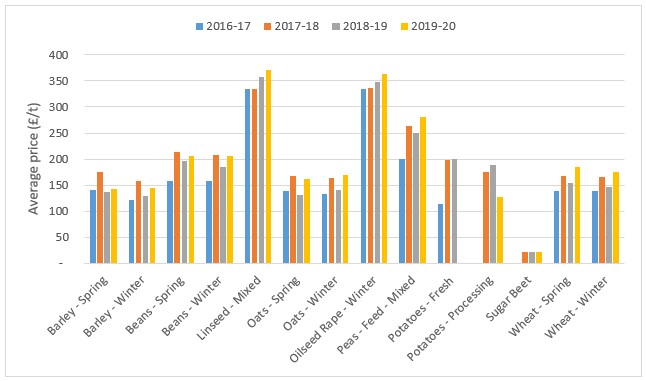
Prices are a reflection of the supply and demand situation and with a very varied last few years of production, the trend has been equally up and down. For combinable crops, the general direction seems to have been increasing prices whilst yields have fallen. But what has that done for incomes?

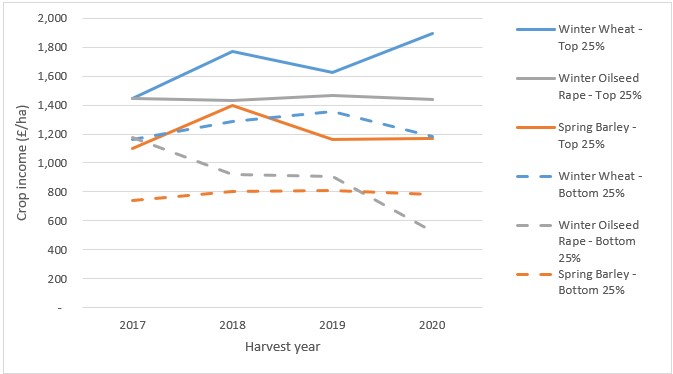
Let us look at the income per hectare of the predominately grown combinable crops of winter wheat, spring barley and winter oilseed rape. For the top 25% group, winter oilseed rape has returned a very consistent income per hectare whereas the bottom 25% has seen a sharp decline.
Despite a swing in income of about £300 per hectare in the top 25%, spring barley had a similar level of income in 2017 compared to 2020. On the other hand, winter wheat income has reported having increased by over £400 per hectare in the last four years for the top 25%, but no change for the bottom quartile.

Ranking of groups is based on net margins. Crop income is sales of grain and staw.
The variable costs
According to Farmbench users, beans, linseed and oats had the lowest variable cost input on average in the last 4 years. The middle 50% reported variable costs of around £220 to £250/ha for these crops. In contrast, potatoes variable costs were 9 times greater on a per ha basis.
It’s a bit of a mixed picture in terms of the trend in the variable inputs depending on the crop and performance group. Some crops, such as barley, oilseed rape and wheat, notably spent more in 2019 but then saw a significant reduction in variable costs in 2020. While others have experienced continual year-on-year increases, like the middle 50% performing fresh market potatoes and linseed crops.
Variable costs - Middle 50% (£/ha)
|
2017 |
2018 |
2019 |
2020 |
4-year Average |
|
|
Beans - Winter |
229 |
222 |
225 |
198 |
219 |
|
Linseed - Mixed |
235 |
242 |
260 |
271 |
252 |
|
Beans - Spring |
249 |
224 |
299 |
238 |
252 |
|
Oats - Spring |
262 |
254 |
267 |
248 |
258 |
|
Peas - Feed - Mixed |
307 |
239 |
315 |
302 |
291 |
|
Oats - Winter |
298 |
298 |
333 |
289 |
304 |
|
Barley - Spring |
312 |
306 |
345 |
310 |
318 |
|
Wheat - Spring |
307 |
342 |
333 |
370 |
338 |
|
Barley - Winter |
404 |
409 |
461 |
430 |
426 |
|
Oilseed Rape - Winter |
446 |
442 |
487 |
425 |
450 |
|
Wheat - Winter |
475 |
498 |
527 |
473 |
493 |
|
Sugar Beet |
n/a |
857 |
860 |
735 |
817 |
|
Potatoes - Processing |
n/a |
1,988 |
2,070 |
2,250 |
2,103 |
|
Potatoes - Fresh |
1,895 |
1,960 |
2,286 |
n/a |
2,047 |
Variable costs include seeds, fertiliser, crop protection, agronomy services and sundry variable items
Gross margins
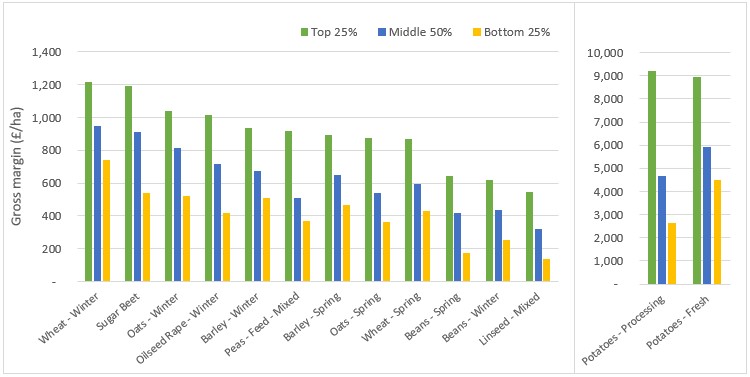
Of the combinable crops, winter wheat produced the highest gross margin for all the performance groups followed by winter oats and winter oilseed rape. Sugar beet gross margins were very close to winter wheat but potatoes had the largest gross margins overall.
Across all the crops the middle performing group had around one quarter to a third lower gross margin compared to the top 25%. The bottom quartile had a similar on average one third lower gross margin compared to the middle 50%.
4-year average gross margins by performance group

Overheads
On a per hectare basis, potatoes and sugar beet have the highest total overheads. Whereas winter wheat carries the largest overheads of the combinables across all the performance groups. Generally speaking, overheads account for two-thirds of the total cost of production. Sugar beet is an exception with these costs making up just over 50% of total costs.
4-year average - 2017 to 2020 - Total overheads (£/ha)
|
Top 25% |
Middle 50% |
Bottom 25% |
|
|
Barley - Spring |
604 |
691 |
867 |
|
Barley - Winter |
670 |
719 |
949 |
|
Beans - Spring |
572 |
678 |
805 |
|
Beans - Winter |
502 |
630 |
778 |
|
Linseed - Mixed |
594 |
710 |
829 |
|
Oats - Spring |
592 |
664 |
859 |
|
Oats - Winter |
633 |
768 |
865 |
|
Oilseed Rape - Winter |
636 |
722 |
873 |
|
Peas - Feed - Mixed |
603 |
645 |
931 |
|
Potatoes - Fresh |
4,138 |
3,900 |
5,505 |
|
Potatoes - Processing |
4,806 |
3,944 |
3,980 |
|
Sugar Beet |
753 |
928 |
1,192 |
|
Wheat - Spring |
567 |
714 |
875 |
|
Wheat - Winter |
674 |
776 |
970 |
Total overheads include a value for unpaid labour, the rental value of owned land, depreciation and finance charges
As such overheads are a main driver of profitability. When total overheads are calculated as a percentage of total income (a function of yield), then there is an even stronger association with net margin. As overheads as a percentage of income reduces, net margin increases.
Net margins
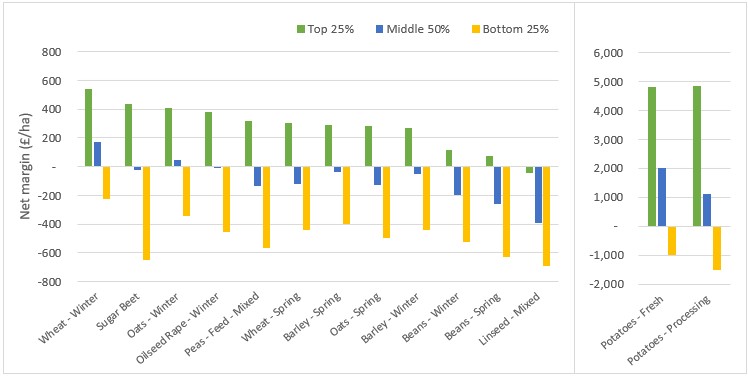
The top 25% performers, apart from Linseed, achieved a positive net margin averaged over the 2017 to 2020 harvest years. When it comes to the middle 50%, only winter wheat, winter oats and potatoes returned a positive net margin per hectare after all costs considered.
4-year average net margins by performance group

Net margin is crop income minus all costs including the value of unpaid labour, rental value of owned land and depreciation. Subsidies are excluded.
When the yield is taken into account, the order changes slightly. In the top quartile, oilseed rape becomes the highest net margin per tonne by a combinable crop, followed by feed peas and winter wheat. However, the middle 50% order is similar to the per hectare results of potatoes, winter wheat and oats. With the exception of barley, the other winter combinable crops outperformed their spring equivalents by £10 to 13/tonne in the top quartile. The range was £7 to 41/tonne in the middle 50%.
4-year average - 2017 to 2020 - Net margin (£/t)
|
Top 25% |
Middle 50% |
Bottom 25% |
|
|
Barley - Spring |
42 |
-6 |
-74 |
|
Barley - Winter |
32 |
-7 |
-68 |
|
Beans - Spring |
13 |
-78 |
-266 |
|
Beans - Winter |
25 |
-71 |
-240 |
|
Linseed - Mixed |
-43 |
-291 |
-652 |
|
Oats - Spring |
42 |
-24 |
-109 |
|
Oats - Winter |
55 |
7 |
-65 |
|
Oilseed Rape - Winter |
92 |
-8 |
-224 |
|
Peas - Feed - Mixed |
73 |
-52 |
-187 |
|
Potatoes - Fresh |
74 |
31 |
-32 |
|
Potatoes - Processing |
94 |
26 |
-38 |
|
Sugar Beet |
6 |
-1 |
-11 |
|
Wheat - Spring |
44 |
-22 |
-91 |
|
Wheat - Winter |
54 |
19 |
-28 |
Net margin is crop income minus all costs including the value of unpaid labour, rental value of owned land and depreciation. Subsidies are excluded.
What does this all mean?
So who was top of the crops over the last four roller coaster years? Aside from potatoes, for the combinables, winter wheat, winter oats and oilseed rape performed well both on a per hectare and per tonne basis. However, it generally requires a top 25% lower level of costs, higher yields and prices to achieve positive net margins.
So should the most profitable crop rotation include all these top crops? Well, things aren’t that simple, of course. Potatoes is a specialist crop that requires the right soil types and a huge amount of investment and preferably a secured market. Oats can be a useful break crop but similarly, a contracted market outlet is preferable. Its no coincidence then that winter wheat and oilseed rape are sown by many growers due to their ready markets and if good yields are achieved then there are highly profitable returns.
Whichever crop is grown, optimising yields to the level of inputs and keeping a tight control on machinery and equipment costs will go some way to achieving top 25% performance. But also, paying attention to detail in these areas plus others such as your marketing strategy, growing for a market, production system, crop rotation.
About the figures
- Figures derived from AHDB Farmbench data: ahdb.org.uk/Farmbench
- Farmbench results from 2017 to 2020 harvest years (Exceptions: Sugar beet 2018 to 2020; Potatoes – Fresh 2017 to 2019; Potatoes – Processing 2018 to 2020)
- Based on 7,850 separate crop enterprise results
- Figures used are conventionally grown crops
- Performance groups are ranked on full economic net margin
- Full economic means they include all non-cash costs to the business. These are the costs you can’t see going out of your bank account – machinery and buildings depreciation, unpaid labour and the rental value of owned land.
Topics:
Sectors:

