Q3 2026 dairy trade review: cheese exports remain the jewel in the crown

Thursday, 19 November 2026

Key trends

  • Cheese exports continued to shine – volumes up 16.6% year-on-year (but value down 2.6%)
  • Total UK dairy export volume for Q3 2026 declined 29.6% year-on-year at 249,300 tonnes due to lower liquid moving across the Irish border
  • Total UK dairy export value stood at £471 million, down 15% year-on-year amid decline in volumes
  • Total import volumes were slightly up, mainly driven by yogurt, butter and cheese

UK dairy exports trended lower

Total export volumes of dairy products from the UK for Q3 2026 witnessed decline for another consecutive quarter year-on-year. Exports of dairy products to the EU saw a major decline of 110,000 tonnes or 35% while that to non-EU nations increased by 5,100 tonnes.

The decline in exports was across all categories except cheese but the biggest loss of volume was in less milk crossing the Irish border for processing. This was reportedly due to environmental issues for one processor on the southern side.

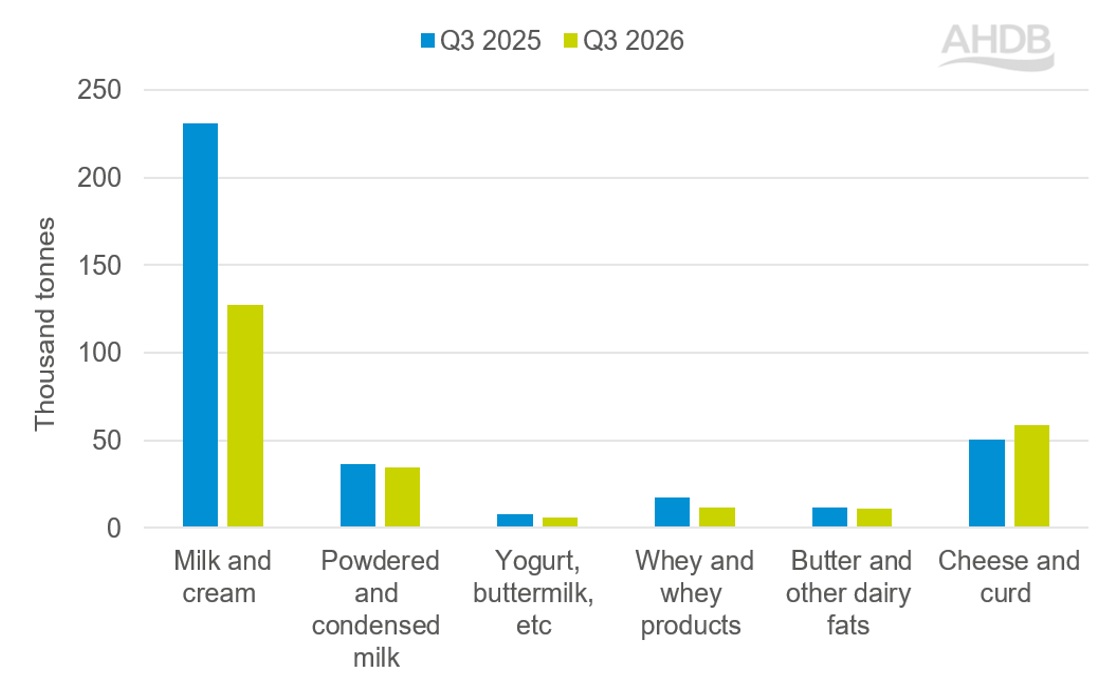
The large increase in cheese exports of 16.6% was offset by the overall decline of other dairy products. In terms of value, decline in exports was seen in milk and cream, butter and cheese.

Cheese

Exports of cheese continued the growth seen since the second quarter of 2025 and volumes of total cheese increased by 16.6% (+8,400 tonnes) year-on-year. In terms of value, exports dipped 2.6% during the period due to weaker commodity pricing.

Globally the biggest increase in cheese volumes were reported to the EU including France (+2,000 tonnes), the Netherlands (+1,200 tonnes), Spain (+600 tonnes), Austria (+500 tonnes), Denmark (+500 tonnes), Belgium (+400 tonnes), and Italy (+300 tonnes).

This was followed by an increase in exports to the Middle East and North Africa (MENA) including Bahrain (+1100 tonnes), Saudi Arabia (+800 tonnes), Algeria (+700 tonnes), Libya (+600 tonnes), Egypt (+500 tonnes), United Arab Emirates (+500 tonnes) and Oman (+200 tonnes).

Exports also picked up to Asia and Oceania including China (+400 tonnes), and Singapore (+200 tonnes).

Logistical challenges due to the ongoing conflict in the Middle East capped the upside movement of exports. Threat remains to our domestic processors from the US particularly in the industrial segment, which is producing cheese at competitive prices following expansion in their capacity.

Powders

Powders saw a decline of 2,100 tonnes (-5.8%) in Q3 2026 year-on-year after seeing some gains in the previous quarter. Decline in exports was reported to both EU nations including the Netherlands (-3,000 tonnes), Greece (-700 tonnes), Belgium (-600 tonnes), Poland (-600 tonnes), Italy (-500 tonnes) and non-EU nations including Egypt (-1,400 tonnes), Pakistan (-1,200 tonnes), Morocco (-1,000 tonnes), Algeria (-800 tonnes), Bangladesh (-800 tonnes).

Exports to China, one of the major importers of powders, remained mostly stable.

The UK produced powders at competitive price during the quarter. Despite this competitive pricing, exports were lower denoting constrained export availability amid tighter supplies in the domestic market and increasing supplies in other major exporting regions.

Butter

Butter exports continued to decline for another consecutive quarter year-on-year but only slightly by 1.2% (-100 tonnes) in Q3 2026 year-on-year. In terms of value, it declined by 39% due to the butter price falling sharply.

The biggest declines were reported from the EU: France (-1300 tonnes), Belgium (-500 tonnes), Italy (-700 tonnes) and Ireland (-200 tonnes). These declines can be attributed to the persistence of excess stocks on the continent, although exports to the Netherlands grew by 800 tonnes.

However, stronger export demand from Kuwait (+300 tonnes), United Arab Emirates (+300 tonnes), Australia (+200 tonnes), Egypt (+200 tonnes), Morocco (+100 tonnes), Saudi Arabia (+100 tonnes) and South Africa (+100 tonnes) helped partially offset the overall decline in exports.

Yogurt

Exports of yogurt saw a decline of 28.3% (-2,300 tonnes) in Q3 2026 continuing the downtrend from last quarter.

Decline in exports to the EU: Ireland (-2900 tonnes) and Asia and Oceania: Singapore (-100 tonnes) were reported during the period in comparison to the same period previous year. However, in terms of value, exports contributed to the total dairy basket as average price is higher year-on-year according to the latest retail data.

Apart from yogurt, milk and cream and whey also contributed to the decline of exports. Milk and cream witnessed the biggest decline of 44.8% (103,400 tonnes) and whey declined by 30.8% (-5,300 tonnes) in Q3 2026 year-on-year. In terms of value, milk and cream contributed to the decline while that of whey increased.

 Figure 1. UK dairy products exports, Jul-Sep (Thousand tonnes)

Exports of milk and cream, powders, yogurt, whey and butter down in Q3 2026, exports of cheese up.

Figure 1 bar chart compares UK dairy export volumes (in thousand tonnes) across six product categories for Q3 2025 and Q3 2026. Each category shows two bars: blue for Q3 2025 and yellow‑green for Q3 2026. Exports of milk and cream, powders, yogurt, whey and butter declined while exports of cheese increased in Q3 2026 compared to the same period previous year.

UK dairy imports slightly up

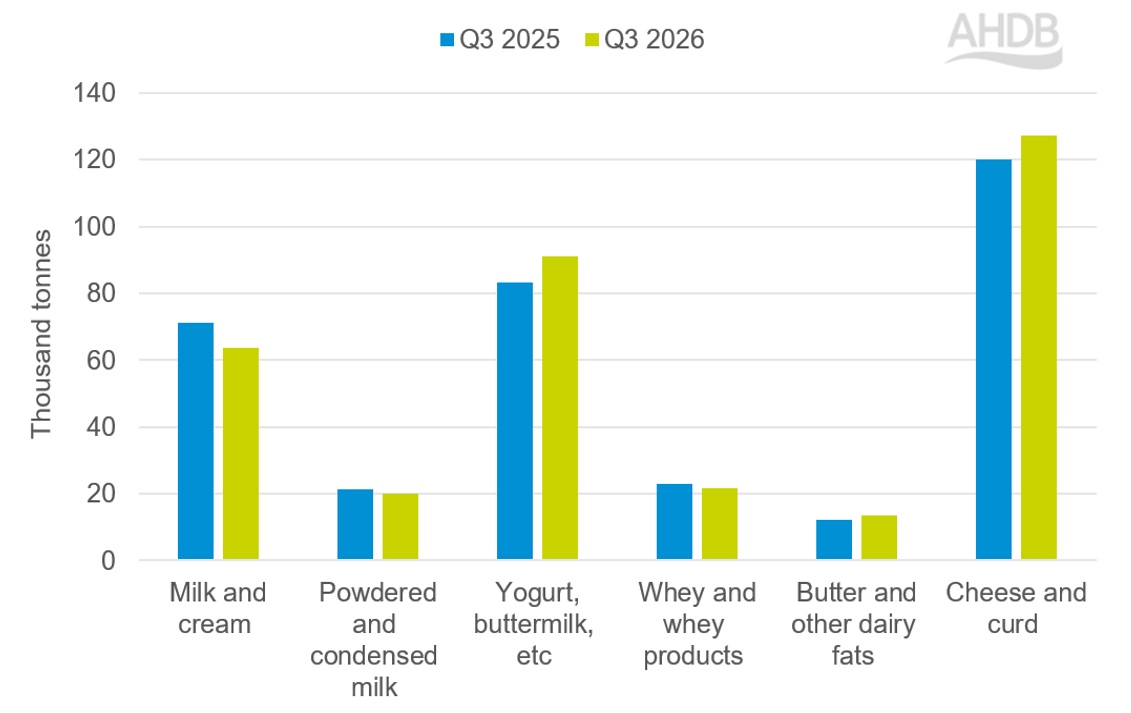
UK dairy imports increased marginally by 1.8% (+6,100 tonnes) to 336,700 tonnes in Q3 2026 year-on-year. Imports from EU nations increased by 0.3% (+1,000 tonnes) mainly from Greece (+8,200 tonnes), France (+3,500 tonnes) and Denmark (+1,800 tonnes). Imports from non-EU countries increased by a whopping 243% (+5,000 tonnes) mainly from New Zealand (+3,000 tonnes) and Switzerland (+2,000 tonnes).

Total import changes by category included:

  • Milk and cream: down 7,600 tonnes (–10.7%)
  • Yogurt: up 7,900 tonnes (9.6%)
  • Cheese and curd: up 7,200 tonnes (6.0%)
  • Butter: up 1,000 tonnes (8.2%)
  • Whey and whey products: down 1,400 tonnes (-5.9%)
  • Milk powders: down 1,100 tonnes (-5.3%)

Imports from Ireland saw the biggest decline (-8,100 tonnes), followed by Belgium (-3,400 tonnes), Germany (-1,500 tonnes), Spain (-700 tonnes), Cyprus (-600 tonnes) and Romania (-300 tonnes). Good retail demand for yogurt and cheese continued to support higher import volumes.

Figure 2. UK dairy products imports Jul–Sep (Thousand tonnes)

Imports of milk and cream, powders and whey down Q3 2026, imports of yogurt, butter and cheese up.

Figure 2 bar chart compares UK dairy import volumes (in thousand tonnes) across six product categories for Q3 2025 and Q3 2026. Each category shows two bars: blue for Q3 2025 and yellow‑green for Q3 2026. Imports of milk and cream, powders and whey declined while imports of yogurt, butter and cheese increased in Q3 2026 compared to the same period previous year.

Roadmap for the UK

AHDB dairy exports team is strengthening the profile of British dairy by actively participating in international trade events and targeted market development activities. They have been exploring growing opportunities in China. While targeted trade mission is aiming to meet the growing appetite for British dairy in Asia and Mexico. Though EU remains our major trading partner, extending our foothold in the emerging markets like Middle East, Asia will be instrumental in diversifying export destinations.

Availability of dairy products will be tight in the coming months following dwindling milk supplies in the domestic market. Increasing imports will be imminent. In such a scenario, exports of value-added products and British speciality cheese could help maximize export returns.

The outlook for dairy trade will be influenced by a range of external factors including weather conditions, evolving trade deals and broader global economic and geopolitical developments. These factors will shape future trade flows and export opportunities for the British dairy industry.


Image of staff member Soumya Behera

Soumya Behera

Senior Analyst (Dairy)

See full bio


Sign up to receive the latest information from AHDB.

While AHDB seeks to ensure that the information contained on this webpage is accurate at the time of publication, no warranty is given in respect of the information and data provided. You are responsible for how you use the information. To the maximum extent permitted by law, AHDB accepts no liability for loss, damage or injury howsoever caused or suffered (including that caused by negligence) directly or indirectly in relation to the information or data provided in this publication.

All intellectual property rights in the information and data on this webpage belong to or are licensed by AHDB. You are authorised to use such information for your internal business purposes only and you must not provide this information to any other third parties, including further publication of the information, or for commercial gain in any way whatsoever without the prior written permission of AHDB for each third party disclosure, publication or commercial arrangement. For more information, please see our Terms of Use and Privacy Notice or contact the Director of Corporate Affairs at info@ahdb.org.uk  © Agriculture and Horticulture Development Board. All rights reserved. 

×