Q2 2026 dairy trade review: cheese exports at an all-time high, whilst other categories disappoint

Thursday, 20 August 2026

How have UK dairy exports performed in Q2 2026?

Key trends

  • Cheese export volumes continued to grow, and are now at an all-time high
  • Milk powders also saw export growth in volume terms
  • Total UK dairy export volume for Q2 2026 declined 25% year-on-year to 277,800 tonnes, driven by milk and cream, yogurt, whey and butter
  • The EU drove export decline
  • Total UK dairy export value stood at £487 million, down 17% year-on-year amid decline in volumes
  • Total import volumes were also down, driven by milk and cream and butter

Cheese and powders volumes boomed whilst total UK dairy exports declined

Total export volumes of dairy products from the UK for Q2 2026 witnessed the first quarterly decline year-on-year since the decline in Q1 2025.

Exports of dairy products to the EU, saw a major decline of 94,400 tonnes while that to non-EU nations increased marginally by 1,400 tonnes.

The decline in exports was mainly driven by milk and cream, yogurt, whey and butter.

An increase in export volumes of powders and cheese limited the overall decline. In terms of value, decline in exports was seen in milk and cream, whey, butter and cheese.

Cheese

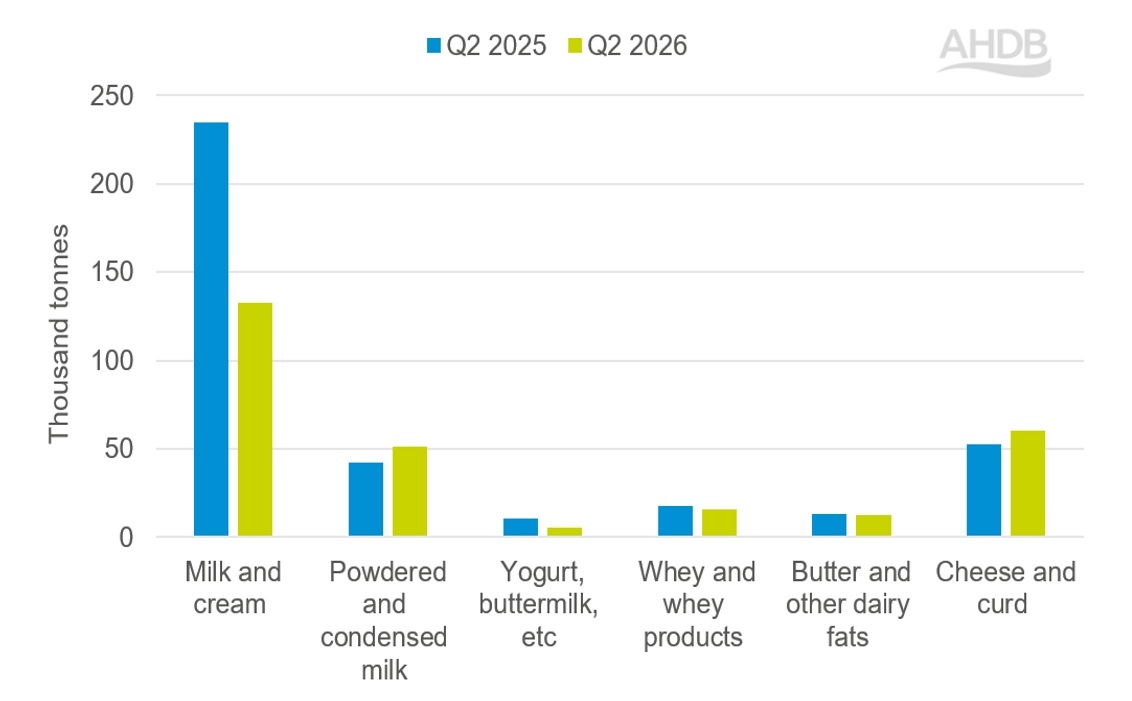
Exports of cheese have continued to grow since the second quarter of 2025 and recorded an all-time high in Q2 2026. Export volumes of total cheese increased by 15.3% (+8,000 tonnes) year-on-year.

Value however declined 4% due to a reduction in commodity prices on global markets.

Globally, the biggest increase in cheese volumes were reported to the EU including the Netherlands (+1,800 tonnes), France (+1,600 tonnes), Belgium (+1,000 tonnes), Germany (+600 tonnes), Austria (+300 tonnes), Spain (+300 tonnes), Ireland (+200 tonnes) and Turkey (+200 tonnes).

This was followed by an increase to non-EU nations like Asia and Oceania including China (+1,000 tonnes) and Singapore (+400 tonnes) and North America including Canada (+100 tonnes).

Exports also picked up to the Middle East and North Africa (MENA): Libya (+1,900 tonnes), Bahrain (+1,400 tonnes), Saudi Arabia (+800 tonnes), Egypt (+200 tonnes) and Sub-Saharan Africa including South Africa (+400 tonnes).

The logistical challenges faced due to the ongoing conflict in the Middle East capped the increase in overall exports to the region.

USA continues to produce cheese at a highly competitive price following expansion in their capacity, and this will pose a challenge for our domestic exporters, particularly in the industrial segment.

Milk powders

Powders saw the biggest increase year-on-year in volumes terms, up by 9,400 tonnes (22.2%): bound for both EU nations such as Denmark, France, Germany, Italy, the Netherlands, Poland and Spain, and non-EU nations including Bangladesh, Egypt, Lebanon, Libya, Malaysia, Mexico, Oman, Qatar, Thailand, Vietnam and Yemen.

Record milk deliveries in the last milk year (2025/26) has resulted in plentiful supplies at a competitive price.

Exports to China, one of the major dairy importers in the global market, continue to be still lower due to weaker consumer demand and declining and ageing population.

Butter

The increase in exports of powders and cheese was completely masked by a decline in exports of other commodities including butter.

Export volumes of butter declined by 4.3% (-600 tonnes) in Q2 2026 year-on-year. Value declined by 37% as the average price of butter remained weak in the second quarter of 2026 compared with the previous year.

The biggest declines were reported from the EU: Belgium (-1,800 tonnes), Italy (-1,000 tonnes), France (-400 tonnes) and Ireland (-300 tonnes).

However, an increase in exports to Australia (+200 tonnes), EU: the Netherlands (+700 tonnes), Germany (+300 tonnes) and Denmark (+200 tonnes), MENA: Libya (+500 tonnes), Egypt (+200 tonnes), Kuwait (+300 tonnes), Saudi Arabia (+200 tonnes), United Arab Emirates (+100 tonnes) and Sub-Saharan Africa including South Africa (+200 tonnes) helped to limit the overall decline in exports.

Yogurt

Exports of yogurt witnessed a significant decline of 49.7% (-5,300 tonnes) in Q2 2026 after a brief period of increase in the last quarter.

Exports to the EU: Ireland (-4,900 tonnes) and Asia and Oceania: Malaysia (-700 tonnes) and Middle East and North Africa: Egypt (-100 tonnes) declined during the period in comparison to the same period previous year.

Milk and cream, Whey

Milk and cream and whey also contributed to the decline of exports. Milk and cream witnessed the biggest decline of 43.5% (-102,000 tonnes) and whey declined by 14% (-2,500 tonnes) in Q2 2026 year-on-year. In terms of value, both milk and cream and whey categories declined.

Figure 1. UK dairy products exports, Apr-Jun (Thousand tonnes)

Exports of dairy products declined in Q2 2026 except cheese and milk powders.

Source: HMRC compiled by Trade Data Monitor LLC

Figure 1 bar chart compares UK dairy export volumes (in thousand tonnes) across six product categories for Q2 2025 and Q2 2026. Each category shows two bars: blue for Q2 2025 and yellow‑green for Q2 2026.

UK dairy imports declined modestly

UK dairy imports declined by 2.0% (-7,100 tonnes) to 342,500 tonnes in Q2 2026 year-on-year.

Imports from EU nations declined by 2.7% (-9,100 tonnes), mainly from Ireland and Belgium. Imports from Ireland saw the biggest decline (-17,500 tonnes), followed by Belgium (-1,500), Cyprus (-500 tonnes), Romania (-500 tonnes) and the Netherlands (-300 tonnes).

Imports from non-EU countries increased by 39.8% (+2,100 tonnes), mainly from Switzerland (+1,600 tonnes), New Zealand (+300 tonnes) and Norway (+100 tonnes).

Growing consumer demand for proteins is driving up the imports of yogurt, cheese and whey.

Total quarterly import changes by category included:

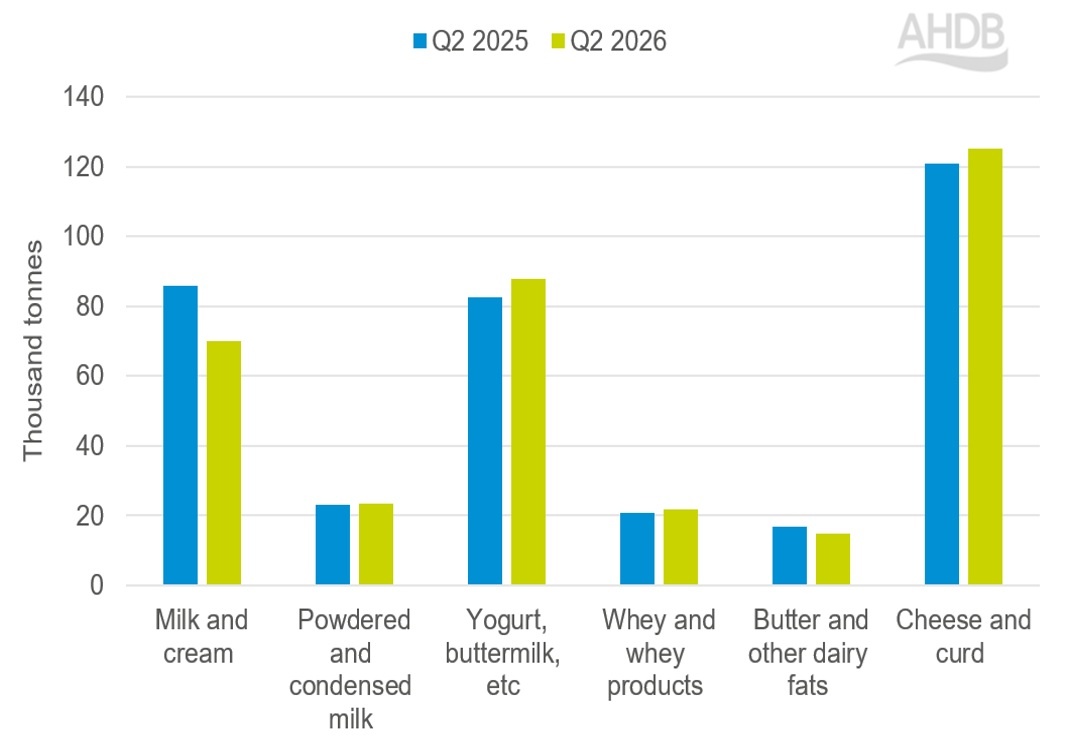
  • Milk and cream: down 15,700 tonnes (–18.3%)
  • Yogurt: up 5,100 tonnes (6.2%)
  • Cheese and curd: up 4,300 tonnes (3.6%)
  • Butter: down 1,900 tonnes (–11.3%)
  • Whey and whey products: up 700 tonnes (3.5%)
  • Milk powders: up 400 tonnes (1.6%)

Figure 2. UK dairy products imports Apr–Jun (Thousand tonnes)

Imports of dairy products declined in Q2 2026 except yogurt, cheese, milk powders and whey.

Figure 2 bar chart compares UK dairy import volumes (in thousand tonnes) across six product categories for Q2 2025 and Q2 2026. Each category shows two bars: blue for Q2 2025 and yellow‑green for Q2 2026.

Opportunities Ahead

Despite an overall decline in dairy exports, cheese exports have recorded an all-time high, emphasizing the continued strength of this category in global markets.

Alongside cheese, powders also added to the increase in the export basket.

Growing global consumer interest in protein rich diets is creating valuable opportunities for our exporters to expand their presence.

In addition, the strong reputation of British speciality cheese presents further potential to drive up export growth.

The dairy exports team have been actively promoting British dairy products through trade events and market development activities across the globe, while also exploring new and emerging markets.

Cheese continues to do well (our main export category), despite a very difficult trading environment. Also, significant growth recorded amid geopolitical challenges and market uncertainty in the Middle East. Asia and Middle East are a key focus of AHDB’s export strategy

Looking ahead, global geopolitical factors, evolving consumer preferences and changes in tariff structure and trade policies will be vital in shaping up the export market.

The latest trade deal between UK and Switzerland is likely to boost dairy exports through improved access for selected dairy products, potentially enhancing the competitiveness of British dairy.


Sign up to receive the latest information from AHDB.

While AHDB seeks to ensure that the information contained on this webpage is accurate at the time of publication, no warranty is given in respect of the information and data provided. You are responsible for how you use the information. To the maximum extent permitted by law, AHDB accepts no liability for loss, damage or injury howsoever caused or suffered (including that caused by negligence) directly or indirectly in relation to the information or data provided in this publication.

All intellectual property rights in the information and data on this webpage belong to or are licensed by AHDB. You are authorised to use such information for your internal business purposes only and you must not provide this information to any other third parties, including further publication of the information, or for commercial gain in any way whatsoever without the prior written permission of AHDB for each third party disclosure, publication or commercial arrangement. For more information, please see our Terms of Use and Privacy Notice or contact the Director of Corporate Affairs at info@ahdb.org.uk  © Agriculture and Horticulture Development Board. All rights reserved. 

×