October 2026 dairy market review

Friday, 13 November 2026

Milk production

Domestic

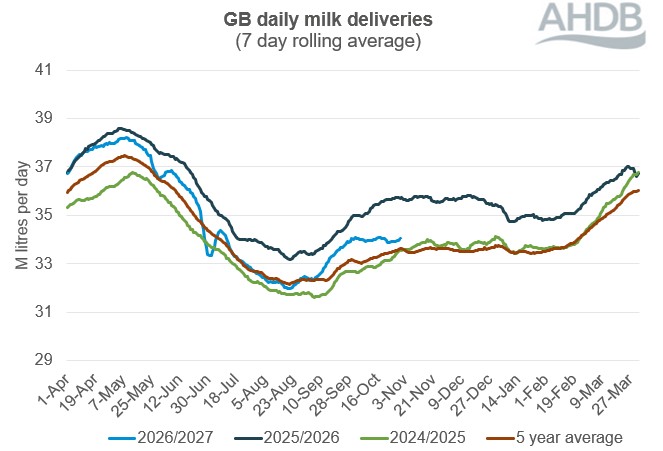
GB milk deliveries in October reduced by an estimated 4.1% year-on-year with milk supplies now annualising against an incredibly strong Autumn in 2025. 

Daily deliveries in October averaged 33.99m litres and totalled an estimated 1,053m litres, a reduction of 4.1% compared to the same month in 2025.  However it is important to note that milk supplies remain above the 5-year average and this is 2nd best supplied October in the past 10 years. This brings milk year to date (April-October) supplies for GB to 2.6% below 2025 levels.

A number of factors explain the decline as we discussed in our October 2026 milk production forecast update.     

Although milk prices increased in August through to October in an effort to secure heat and drought related falling milk supplies, margins remained challenged by rising input costs, particularly for forage, fuel and fertiliser.

The Milk to Feed Price Ratio (MFPR) did ease due to the increases in milk prices but not enough to offset other input cost growth.                       

There are a number of further factors that support further reductions in milk supplies: bluetongue virus spread rapidly through the country although reportedly most dairy herd have elected to vaccinate, input costs remain high impacted by the war in the Middle East, feed costs also saw some uptrend due to global drought and the war in Ukraine although has since settled.

Milk prices will therefore need to compensate, even without full support from commodity markets to maintain supplies. This could be challenging given the weak position on fats.

  Line graph showing GB daily milk deliveries over a 12-month period to 31 October 2026

Figure 1. GB daily milk deliveries

Source: AHDB

Line graph shows GB daily milk deliveries over time that rise in the spring flush and then fall before rising through the autumn. The graph shows that in July the 2026/27 line (the shorter line) continues to fall from the 2025/26 line (at the top) but then dips below the five-year average (the bottom longer line). 

Milk price announcements were positive from June through to October but were mostly steady for November. December announcements so far look to be following suit barring a large 7ppl cut from Freshways. 

Organic milk supplies


GB Organic milk deliveries
 have been gone into decline again after some recovery in the Autumn.

Global

The latest global production data estimate shows growth in global milk flows continuing across milk-producing regions. 

  • Global milk deliveries averaged 821.8 million litres per day in August, an increase of 13.4 million litres per day (+1.7%) across the selected regions, compared to the same period last year.
  • Milk deliveries in the EU averaged an estimated 393.3 million litres per day in August, an increase of 2.9 million litres per day (+0.6%) compared to the same month of the previous year.
  • US production was up 2.4% year-on-year, with production at 284.8 million litres per day in August. This is supported by an increasing dairy herd, positive farm margins aided by high prices for calves and culls and lower culling rates due to high investment in processing capacity.
  • Australian production increased 0.9 million litres (+4.2%) to sit at 22.2 million litres.
  • New Zealand deliveries were up by 1.1 million litres per day (2.4%) compared to last year, with August average daily deliveries at 46.3 million litres per day. Firm milk prices and ideal weather conditions have boosted farm productivity.
  • Argentina’s production rose in August, up 0.8 million litres per day (+2.2%) year-over-year.

Rabobank estimate global milk supply growth to slow to 0.5% in H2 2026 with stabilisation in 2027.

Available dairy supplies

Dairy product supplies in Q2 tightened for both cheese and butter in line with weakened milk production. However, butter stocks were starting from a high base and remain over-stocked despite some tightening of 7.6%. 

Cheese stocks also tightened due to falling production and growth in exports.  Imports also grew, however, resulting in cheese stocks falling by 3.3%.

Wholesale markets: August

  • The cream price fell £180/t to £1,528 as demand weakened and milk supply fears waned
  • Butter fell £240/t to £3,300/t as volume of stocks weighed heavily on the market
  • Mild cheddar prices dropped £40/t to £3,290, influenced by the weakness of fats
  • SMP performed strongly, gaining £200/t over the month for an average of £2,930/t

Although milk supplies remain back on a year ago, with October to date down by 3.2%, this varied regionally with reports from the South West indicating greater constriction on supplies than those whose milk pools further north (which  have been less affected by both drought and bluetongue virus). 

However, sentiment is certainly less concerned about milk volumes than we saw last month, and markets have responded negatively with the impact of high stocks and high global supplies coming back into the driving seat. 

This does cast doubt on the sustainability of some of the Autumn milk price rises that have been previously announced depending on the product mix for individual processors.

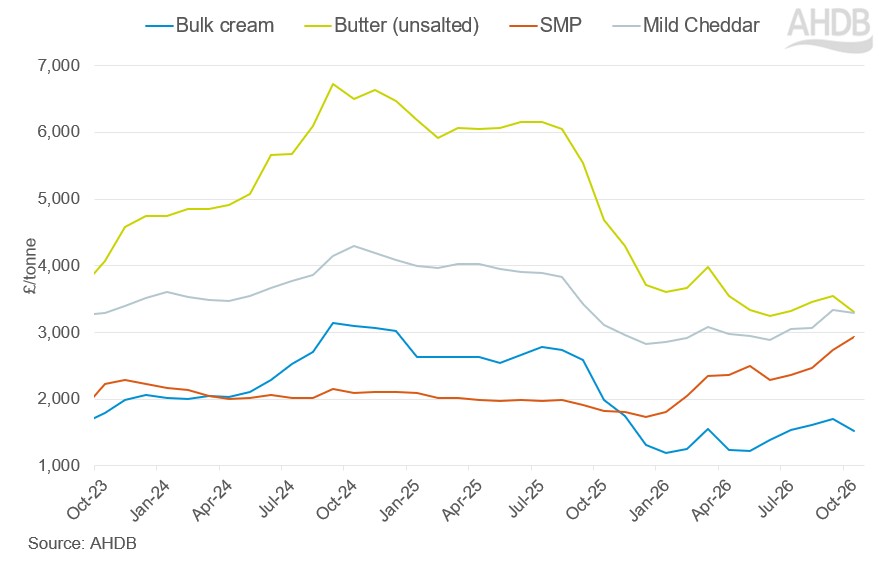
Graph showing UK wholesale dairy prices.

The latest GDT (Global Dairy Trade) auction results showed some positivity with a change in the index of 3.0% to $4,166/t.  This was driven primarily by WMP and SMP which rose by 5.9% and 3.1% respectively. Cheddar rose by 8.6%.  On the fats side, butter fell by 4.7% and AMF by -3.2%. 

Figure 1. UK wholesale prices from early 2023 to July 2026

  Figure 1 shows average UK wholesale prices from early 2023 to October 2026 for bulk cream, butter (unsalted), skimmed milk powder (SMP) and mild Cheddar, measured in £s per tonne. SMP is now increasing in value whilst butter and cream are falling with a more stable outlook for cheddar.


Farmgate milk prices 

The latest published farmgate price was for September 2026 and was announced by Defra as being  38.45ppl, up 1.78 pence on the previous month

Latest announced farmgate prices for November saw some uplifts in the period.

On retail aligned liquid contracts, buyers’ on the AHDB league table announcements were mixed. Muller Tesco lowered its price by 0.21ppl. Muller Co-op Dairy Group and Sainsbury’s increased their price by +0.72ppl and +0.14ppl respectively. Muller M&S and Waitrose made no change to their price this month.

Looking to non-aligned liquid contracts, prices remained steady to firm. Crediton Dairy up 2.00ppl for. Freshways and Payne’s Dairies held for November. Muller Direct increased their price by 0.5ppl. Pembrokeshire Creamery made a positive announcement of 1.13ppl.

Cheese contracts were largely consistent except for one buyer on the AHDB league table. Lactalis made a positive announcement for the sixth consecutive month, increasing their price by 0.57ppl.

Manufacturing contracts were mostly steady apart from one buyer. UK Arla Farmers Manufacturing lowered their price by 0.45ppl after seven consecutive months of increase in price.


Retail demand

During the 12 weeks ending 3 October 2026, volumes of cows' dairy increased by 0.6% year-on-year. Spend on cows' dairy increased by 1.4% year-on-year due to price increase. Growth in cows' dairy was driven by cheese, yoghurt and yoghurt drinks and cream. These gains helped offset volume declines in milk.

Cow’s milk

Milk volumes declined by 0.4% year-on-year¹, while spend increased by 1.1%, driven by a 1.6% increase in average price per litre.

Declines were seen for semi-skimmed (−2.2%) and skimmed milk (−2.8%). Whole milk continued to outperform the category, with volumes increasing by 3.1%. Other cows also performed strongly, increasing by 79.7%. Growth in these milk subcategories may reflect consumer interest in more natural and less processed products.

Plant-based milk volumes remained broadly stable (+0.2%), while spend increased by % due to higher average prices.

Cows' cheese

Cow cheese remained in volume growth, increasing by 1.8% year-on-year¹. Spend declined by −0.7%, possibly due to a −.4% decrease in average prices.

Volume growth was led by other cow cheese (+10.2%), supported by strong sales of cottage cheese and soft white cheese, followed by snacking (+4.1%) and speciality and continental (+3.5%). All these cheese categories seeing the most growth through increasing purchase frequency.

These gains offset declines in cheddar (−1.7%), British regionals (−3.0%), processed (−1.1%) and stilton and British blue (−12.7%).

Cows' butter

Butter volumes declined by 2.5% year-on-year¹. Spend decreased by 6.9% due to average prices paid falling by 4.6% per kilo.

Block butter remained the strongest-performing butter segment, with volumes increasing by 3.7% due to an increase in people buying it. However, this growth was not enough to offset declines in butter spreads, which fell by 5.6% primarily due to less buyers, resulting in an overall decline for the category.

Cows’ yoghurt, yoghurt drinks and fromage frais

Cows' yoghurt, yoghurt drinks and fromage frais volumes increased by 7.2% year-on-year¹, with spend increasing by 9.7%. Average prices paid rose by 2.4%.

Growth was driven by increased volumes purchased across several yoghurt subcategories. Standard plain yoghurt (+18.0%), healthy yoghurt (+16.8%) and fat-free yoghurt (+10.2%) were among the strongest performers. Yoghurt drinks also remained in growth (+6.4%), reflecting continued demand for convenient products.

However, some subcategories remained in decline, including kids (−3.9%), standard flavoured (−2.2%), split pot (−1.6%) and fromage frais (−4.0%). This could be a result of consumer health trends and a push for less ultra processed foods.

Cows' cream

Cream volumes grew by 0.3% year-on-year¹. Spend increased by 0.5%, while average prices paid rose by 0.2%.

Performance was mixed across the category. Double cream (+2.2%), whipping cream (+9.6%) and sour cream (+0.9%) remained in growth due to an increase in volume per trip for all, while declines were seen for single cream (−3.5%), crème fraiche, clotted cream (both −7.2%) and aerosol (−1.8%).

See the full data and these insights visualised on our GB household dairy purchases retail dashboard.

¹ NIQ Homescan POD, Total GB, 12 w/e 3 October 2026 


Sign up to receive the latest information from AHDB.

While AHDB seeks to ensure that the information contained on this webpage is accurate at the time of publication, no warranty is given in respect of the information and data provided. You are responsible for how you use the information. To the maximum extent permitted by law, AHDB accepts no liability for loss, damage or injury howsoever caused or suffered (including that caused by negligence) directly or indirectly in relation to the information or data provided in this publication.

All intellectual property rights in the information and data on this webpage belong to or are licensed by AHDB. You are authorised to use such information for your internal business purposes only and you must not provide this information to any other third parties, including further publication of the information, or for commercial gain in any way whatsoever without the prior written permission of AHDB for each third party disclosure, publication or commercial arrangement. For more information, please see our Terms of Use and Privacy Notice or contact the Director of Corporate Affairs at info@ahdb.org.uk  © Agriculture and Horticulture Development Board. All rights reserved. 

×