Inflationary pressures impact Easter 2022
Monday, 30 May 2022
We were hoping that Easter 2022 would look more normal than Easter 2021. However, after 2 years of COVID impact, this Easter was influenced by the cost-of-living crisis, including rising prices in stores and consumers having less disposable income. Inflationary pressure hit +5.9% in the 4 w/e 17 April 2022 which impacted people’s ability to celebrate.
The market & Easter categories
While we saw Easter start to bounce back in 2021 as restrictions eased with outdoor socialising allowed. This year grocery performance struggled to annualise as we had less in-home occasions, with volumes down 8.8% in packs (Kantar, 3w/e 17 April 2022 vs 3w/e 4 April 2021). However, with the eating out market still recovering, we saw slight growth in retail on 2019, up 1.4%. Frequency in the out-of-home market is still 14% smaller in April 2022 versus April 2019 (Kantar OOH, 4 w/e 17 April 22). While COVID is a lower concern this year (37% of consumers were concerned about catching Covid in April) the rising cost of living is forefront, being a concern for 84% during April 2022 according to consumer research agency Two Ears One Mouth.
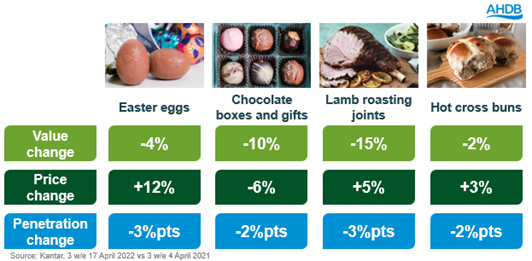
Despite prices rising for key Easter categories, losses in penetration drive overall value declines year-on-year.

The context of the weather is important when assessing the performance of certain food categories, as April is a time when BBQs can be potentially fired up. Easter 2022 saw temperatures slightly above average, meaning some will have braved the outdoors. This is compared to lacklustre temperatures last year, but with COVID rules allowing only outside socialising, some may have chosen to BBQ. However, when we compare back to pre-Covid, 2019 was the warmest Easter on record making it important context to consider when looking at the performance of meat, fish and poultry (MFP).
MFP - Roasting
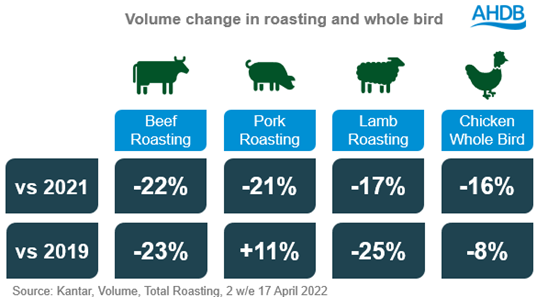
In the two weeks to Easter 2022, 9million kg of roasting joints were sold through retail according to Kantar. This is down 19.2% year-on-year even though consumers were able to socialise indoors this year. Longer term the category also saw declines, down 18.2% versus 2019, when roasting took a back seat to BBQs.

This decline is spread out across the main proteins, as almost all see the exact same trend for roasting/whole bird, implying some consumers are switching off from the traditional roast dinner occasion. The losses are most evident among older consumers.
Price inflation is seen across roasting offerings, having a negative impact on the number of shoppers who bought into the category. Lamb the most traditional Easter roast (21% share of roast volumes in 2022 compared to 6% share for rest of year) saw the biggest increase in price and the fastest volume losses. In comparison pork roasting saw the smallest increase in price and the slowest volume losses, highlighting the real reality of shoppers spending ability. 57% of lamb losses were from shoppers leaving the roasting category completely and 12% through shoppers switching to other, cheaper, protein options - most notably chicken. With chicken being particularly popular among younger consumers.

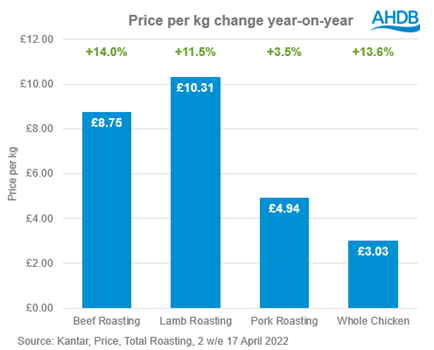
Lamb has the highest price point of any meat roasting in the market, at £10.31/kg, roughly £4 more than the market average. Lamb also sees an inflation rate of +11.5% YoY compared to the average of +9.7%.
Further indications of the impact of inflation this Easter:
- Retailers that supported roasting promotions won share
- The economy tier of roasting, despite being small (4.3% share of roasting category), was the only tier to see growth
MFP – BBQs
Despite being slightly better BBQing weather in 2022, compared to 2021 burger and sausage volumes were down 9.5%. Consumers are returning to the eating out market, so less everyday meals are eaten at home, of which burgers and sausages are some of the most popular. Versus 2019 volumes were also down -1.6%, unsurprising due to record breaking weather in 2019. Inflation is also apparent in this category, with price per kg up 10.7% versus 2019 which equated to an additional £3.5m spend during this Easter.
Total MFP and Meat-free
As two of the biggest categories for Easter saw declines this year, this impacted total MFP volumes, down 11.6% year-on-year. In the long term, we also see a decline for the 2 weeks to Easter compared to 2019, down -3.1%. This goes against the trend we see for total grocery, showing the impact that higher prices are having on MFP in particular.
Meat-free also saw a decline year-on-year, down -1.8% versus 2021, reversing the trend of significant volume growth at Easter across the last 3 years. Price rises for meat-free may have influenced shoppers to reduce the volume they buy, or drop out of the category, driving declines.
Considerations for Easter 2023
- The cost of living crisis is going to continue in to 2023; consider how to combat consumer spending pressures through activations such as promotions
- Roasting occasions have lost out; remind consumers of the traditional celebratory meal.
- Inspire the younger consumer beyond chicken
- Supermarkets and convenience stores overtrade at Easter for roasting as shoppers like to see expensive cuts before purchase; ensure strong in-store positioning and communication
- Cater for both weather occasions with roast and BBQ options in store and online
Note – Easters are compared to equivalent Easters in previous years due to the event moving on an annual basis


Sign up for regular updates
You can subscribe to receive the consumer insight newsletter straight to your inbox. Simply fill in your contact details on our online form
While AHDB seeks to ensure that the information contained on this webpage is accurate at the time of publication, no warranty is given in respect of the information and data provided. You are responsible for how you use the information. To the maximum extent permitted by law, AHDB accepts no liability for loss, damage or injury howsoever caused or suffered (including that caused by negligence) directly or indirectly in relation to the information or data provided in this publication.
All intellectual property rights in the information and data on this webpage belong to or are licensed by AHDB. You are authorised to use such information for your internal business purposes only and you must not provide this information to any other third parties, including further publication of the information, or for commercial gain in any way whatsoever without the prior written permission of AHDB for each third party disclosure, publication or commercial arrangement. For more information, please see our Terms of Use and Privacy Notice or contact the Director of Corporate Affairs at info@ahdb.org.uk © Agriculture and Horticulture Development Board. All rights reserved.

