Farmbench - Making financial sense of growing oilseed rape
Friday, 5 March 2021
There has been a continuing decline in area planted for oilseed rape (OSR) in Britain as many growers face pressure from pests and the weather. OSR can play a vital role in many rotations. Wheat production in particular benefits from OSR in the rotation. Few alternative break crops exist that either has such a beneficial effect, have good market opportunities or can be grown widely or consistently in the UK.
This article will provide financial benchmarks, examine what is the main driver of income and indicate what level of costs is required to still make money at different levels of yield.
AHDB has examined the farm business performance data in Farmbench from the 2017 to 2019 harvest years for conventional winter-sown OSR and concluded that:
- Achieving a positive return with winter OSR has become more difficult in the last three years
- However, the top 25% have still been able to get a reasonable return and not necessarily by getting the highest yields
- A positive return can be achieved from lower yields if the costs can be kept low (£900 - £1,000/ha)
Farmbench benchmarks
The following shows the three-year average results for harvests 2017 to 2019 as recorded in Farmbench.
| Top 25% | Middle 50% | Bottom 25% | |
|---|---|---|---|
| Yield (t/ha) | 4.10 | 3.58 | 3.00 |
| Crop Income1 (£/ha) | 1,425 | 1,227 | 997 |
| Variable Costs (£/ha) | 414 | 436 | 463 |
| Gross Margin (£/ha) | 1,011 | 791 | 534 |
| Overheads (£/ha) | 609 | 721 | 882 |
| Total Cost of Production (£/ha) | 1,023 | 1,157 | 1,346 |
| Net Margin (£/ha) 2 | 402 | 69 | -348 |
1Income from the crop only excludes subsidies
2Performance groups ranked by net margin results
Between the top 25% and the rest, difference in net margin was around 60% due to higher income and 40% due to lower costs. So was yield or price the main influence on income?
Is it all about yield?
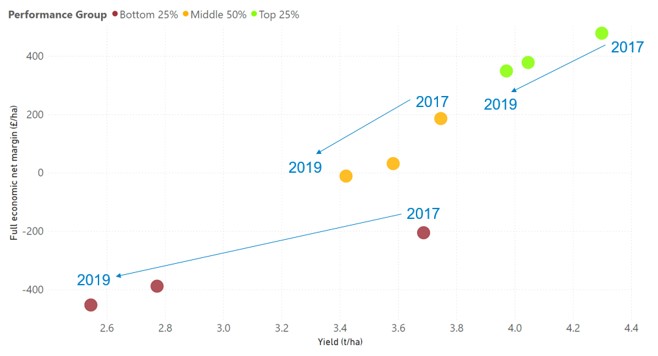
Yields have declined for all performance groups in the last 3 years with the bottom 25% group reducing the most. Also, average net margins have declined for all performance groups.

*Net margin is crop income less all costs including depreciation and a value for unpaid labour, rent and finance but excluding subsidies.
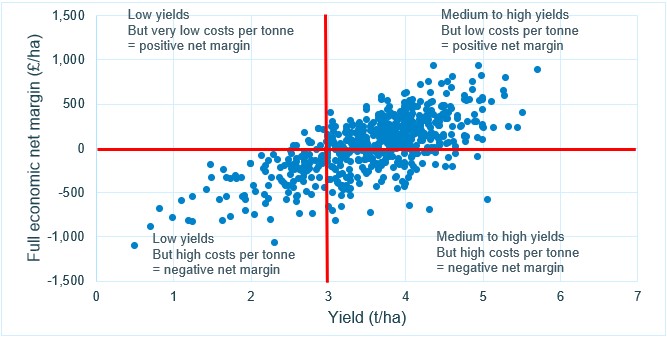
The middle 50% reported a £200/ha net margin in 2017 but a £11/ha loss in 2019. In 2019, approximately half of the OSR crops made a positive net margin (over two thirds in 2017). The majority of crops achieving a positive net margin had yielded over 3t/ha.
However, there were many OSR crops which despite getting over 3t/ha, still made a loss. In contrast, there were a small number that yielded less than 3t/ha that still reported a positive margin.

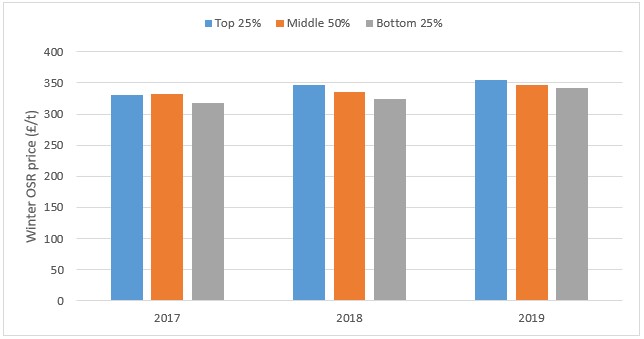
Looking at prices received over the three years, they were relatively stable in comparison to yield. Prices between the top and bottom groups differed by only around 4%.

In terms of variable costs, seeds, fertiliser, herbicides and not unsurprisingly, insecticides (with the withdrawal of neonics) all increased in the three years. However fungicide costs fell.
Overheads (fixed costs), increased in 2018 but then came back in 2019. The only consistent trend was with the cost of labour which reduced by £40/ha in the three years.
In 2019, total costs of production for the top quartile group was £1,060/ha, 11% lower than the middle group. Total costs includes all cash costs of production plus machinery and buildings depreciation, a value of unpaid labour, the rental value of owned land and finance charges
Yield versus cost of production
So what do the Farmbench results tell us about what level of cost of production do you need to still achieve a positive net margin at a certain yield?
The table below provides a benchmark of the average cost of production from those crops that made a positive net margin in the three years, at different yield levels.
| Yield (t/ha) | Total cost of production (£/ha) | Variable costs (£/ha) | Overheads (£/ha) |
|---|---|---|---|
| 2.5 - 2.9 | 902 | 370 | 532 |
| 3.0 - 3.4 | 1,008 | 397 | 611 |
| 3.5 - 3.9 | 1,100 | 425 | 675 |
| 4.0 - 4.4 | 1,134 | 434 | 700 |
| 4.5 - 4.9 | 1,224 | 446 | 778 |
| 5.0 - 5.4 | 1,320 | 451 | 869 |
* Total costs includes all cash costs of production plus machinery and buildings depreciation, a value of unpaid labour, the rental value of owned land and finance charges
At the lower yield levels of 2.5 to 3.5t/ha, margins will tend to also be lower. If you are in a situation where your yield potential is being limited by pests or the weather, these figures may provide some guidance of what level of what level of costs to budget for. Achieving for a cost of production of around £900 to £1000/ha could increase the chance of generating some profit.
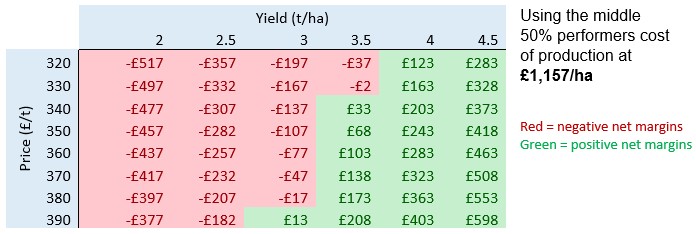
This can be illustrated with a sensitivity analysis which when you take a particular level of total costs demonstrates what the net margin could be at different yields and price points.
The tables below use the middle 50% level of costs of production at £1,157/ha and the top 25% performers level of total costs at £1,023/ha.


The blue boxes highlight where the top 25% can still make a positive margin compared to the middle 50%. For example, at a yield of 3t/ha and a price of £360/t the top 25% could make a net margin of £57/ha, whereas the middle 50% would make a loss of £77/ha.
What does this all mean?
For some growers OSR remains an important part of the rotation and will continue with the crop. For some others, the pressure that pest, disease and weather impacts has been too great and may have given up to try a new approach with another crop. For the rest in the middle ground they are grappling with the decision on how long they can continue to overcome the challenges and low yields.
These figures will hopefully provide a useful benchmark on what others are acheiving to postion themselves in the top 25%. Particularly for those who continue see the vital inclusion of OSR in their rotation. Those who currently only achieve lower yields and sticking with the crop and looking to improve margins, these figures will hopefully provide some reassurance and hope.
About the figures
- Farmbench results based on harvest 2017, 2018 and 2019
- OSR figures for conventional winter sown excluding any seed, HEAR or hybrid variety crops
- Benchmarks are ranked on full economic net margin
- Full economic means they include all non-cash costs to the business. These are the costs you can’t see going out of your bank account – machinery and buildings depreciation, unpaid labour and the rental value of owned land.
Topics:
Sectors:

