How do UK wheat overhead costs stack up internationally: Grain market daily
Wednesday, 27 March 2024
Market commentary
- UK feed wheat futures (May-24) closed at £170.00/t yesterday, down £3.50/t from Monday’s close. New crop futures (Nov-24) closed at £191.50/t, down £2.50/t over the same period.
- UK feed wheat futures followed both the Chicago and Paris wheat markets down yesterday. Wheat futures continue to feel pressure from plentiful global supplies with Black Sea grain still pressuring the market. Further to that, the Chicago market ended lower from technical trading, a strong US dollar and fading demand in China.
- The market awaits further news as the USDA’s 2024 Prospective Plantings and quarterly Grain Stocks reports will be released tomorrow (28 Mar).
- EU soft wheat exports were down 2% at 22.8 Mt by March 23 for the 2023/24 season and imports up by 4% at 7.12 Mt. Competitively priced Ukrainian wheat has continued to be imported into the EU, making up near 5 Mt of those imports (EU commission).
- Paris rapeseed futures (May-24) closed yesterday at €452.00/t, down €5.00/t from Monday’s close. The Nov-24 contract ended the session at €458.00/t, down €3.25/t over the same period. Paris rapeseed futures followed pressure in Chicago soyabeans which were down after a choppy trading session as farmers sold some old-crop supplies ahead of the USDA data release tomorrow (LSEG).
Sign up to receive the Weekly Market Report and Grain Market Daily from AHDB.
How do UK wheat overhead costs stack up internationally?
As highlighted in the first article of this series, AHDB submits data representing a range of ‘typical’ UK farms into an international benchmark database each year. With this data we can compare and analyse how UK cash crop production compares to key competitors around the world.
This article will focus on overheads, particularly labour, machinery and land costs. These costs are typical for each nation and include a mix of feed and milling wheat data, averaged over five years (2018–2022). As in our previous article, the countries in this analysis include Canada, Germany, Denmark, Spain, France, Ukraine, the UK and the US. So, how do our overheads compare?
Labour
Labour costs include both family labour and hired labour. Family labour accounts for the opportunity cost of family labour. Hired labour is any cost relating to employed labour such as wages, National Insurance and pension contributions.
At £180.80/ha, labour cost in the UK is relatively average – much lower than the likes of France and Denmark but much higher than the US, Canada or Spain. Anecdotal reports suggest that lower labour costs in the US and Canada are largely due to efficiencies brought about by larger field sizes and the scale of their machinery and equipment. Fewer fertiliser and crop protection passes also contribute to the low cost, with the US spending just 2.43 hrs/ha and Canada 1.82 hr/ha, compared to 13.71hrs/ha in the UK.
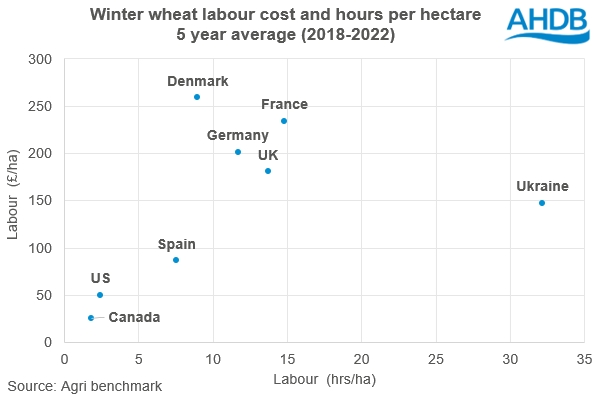
The UK also has a more even split in terms of hired and family labour. This is perhaps unsurprising, with a typical farm in the UK operated by one farm business owner and one employee. At the other end of the scale, in Ukraine, family labour is minimal, with much greater-sized corporate farms employing larger workforces drawn from local communities.
Machinery
Machinery costs include contracting costs, fuel, repairs and equipment depreciation. Finance costs are included within these figures.
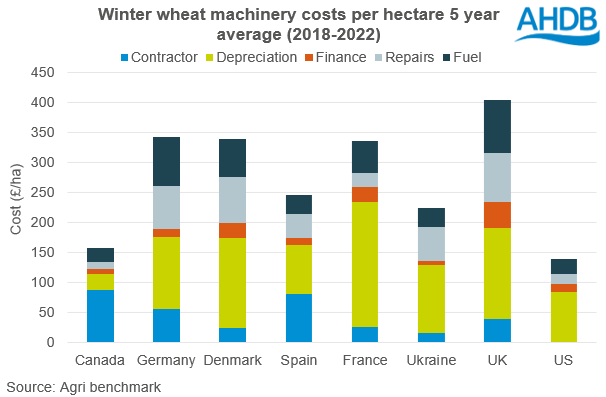
Machinery costs for the UK, at £403.82/ha, are the highest per hectare of all countries within the comparison. Fuel (£87.70/ha) and repair costs (£81.74/ha) are particularly high for the UK, whereas contracting costs are relatively average within the comparison. This suggests that it is not just ownership which is key to the UK’s machinery costs but relatively demanding equipment use compared to other countries, which aligns with the relatively high number of input applications and field passes to establish the UK crop.
Canada, the US and Ukraine have the lowest total machinery costs (under £225/ha), despite a tendency for large equipment size in these countries. For example, typical Ukrainian farms use several machines over 300hp. These are also the countries with the lowest inputs for wheat, as discussed in the first article of this series. This shows lower machinery costs are not only related to the typically large farm size in these nations, which helps dilute machinery depreciation costs, but also to the relatively low level of inputs requiring fewer passes over the land.
Depreciation tends to be one of the most significant costs in this area. The four countries with the lowest depreciation costs (Canada, Spain, Ukraine and the US) are also achieving the lowest total machinery costs.
Land
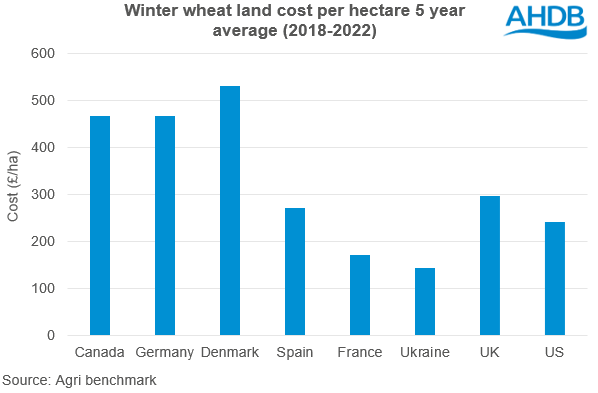
The land cost entered shows the rental value equivalent per hectare for arable grade land within those countries, plus land-improvement costs.
As expected, the land value varies greatly across the comparison. However, surprisingly, the UK land value at £296.44/ha is relatively low in contrast to Denmark (£530.05/ha), Germany (£465.31/ha) and Canada (£467.27/ha). The Canadian results were particularly surprising; anecdotal reports suggest this could be influenced by higher rental values in Eastern Canada, where the farming system is more similar to Western Europe. Low availability of land for rental and high capital value may also be factors.
France shows a surprisingly low land value at £169.97/ha, and Ukraine is the only country lower than this at £142.03/ha. This is due to strong regulation of land rents by the French government, based on land type and location, as well as farm incomes and inflation.
Conclusion
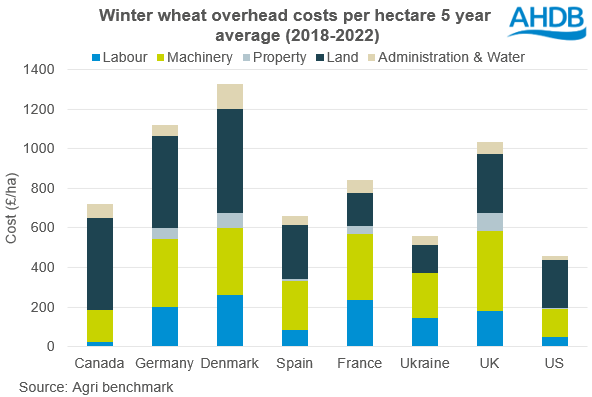
There is a large variation of roughly £900/ha between the total overhead costs of countries within our comparison. It is notable that the countries with the lowest total costs per hectare (Canada, Spain, Ukraine and the US) are also those which are most efficient with labour and machinery. This suggests that gains in operational cost efficiency is a key factor to reducing overhead costs.
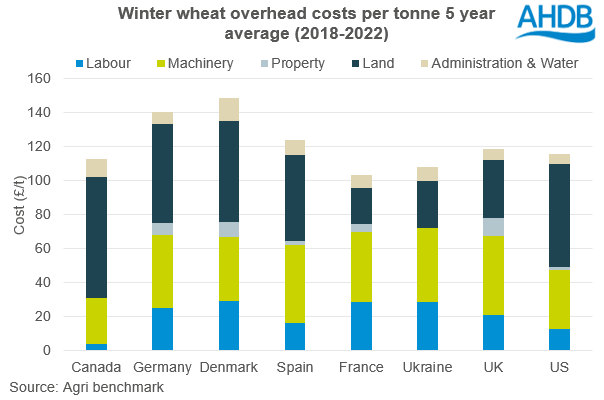
While the UK has one of the highest total overhead costs per hectare, per tonne (£118.84/t) is where we see the efficiency of the high input system. On this basis we see the cost difference between countries reduce. Here, the UK overheads are within £20/t of the lowest cost system, France (£103.14/t), and very similar to the US (£115.51/t). This shows the importance of yield within the UK system to drive efficiency of input and overhead costs. As we look to our upcoming 2024 harvest, it is worth considering how the expected lower yields will impact our cost of production. We will explore this theme further in later articles in this series.


Sign up to receive the latest information from AHDB.
While AHDB seeks to ensure that the information contained on this webpage is accurate at the time of publication, no warranty is given in respect of the information and data provided. You are responsible for how you use the information. To the maximum extent permitted by law, AHDB accepts no liability for loss, damage or injury howsoever caused or suffered (including that caused by negligence) directly or indirectly in relation to the information or data provided in this publication.
All intellectual property rights in the information and data on this webpage belong to or are licensed by AHDB. You are authorised to use such information for your internal business purposes only and you must not provide this information to any other third parties, including further publication of the information, or for commercial gain in any way whatsoever without the prior written permission of AHDB for each third party disclosure, publication or commercial arrangement. For more information, please see our Terms of Use and Privacy Notice or contact the Director of Corporate Affairs at info@ahdb.org.uk © Agriculture and Horticulture Development Board. All rights reserved.

