Analyst insight: How do UK wheat input costs stack up internationally?
Wednesday, 6 March 2024
Market commentary
- UK feed wheat futures (May-24) closed yesterday at £161.75/t, down £1.30/t from Monday’s close. The Nov-24 contract fell £1.60/t over the same period, ending the session at £179.50/t.
- Domestic futures followed EU and US markets down yesterday. Pressure from competitive Russian supplies continues. Algerian state grains agency OAIC bought milling wheat in an international tender yesterday, with Russia as the likely origin (LSEG).
- Paris rapeseed futures (May-24) ended yesterday at €422.25/t, up €5.00/t from Monday’s close. New crop futures (Nov-24) climbed €3.75/t over the same period, to close at €426.25/t.
- Despite losses in US soyabean markets yesterday, Paris rapeseed futures were supported by news of adverse weather in India. As with wheat, the Indian rapeseed crop has been impacted by heavy rainfall and hailstorms recently. According to a trader in the area, production is expected to be at least 5% lower than anticipated before the crop was damaged (LSEG).
How do UK wheat input costs stack up internationally?
Each year, AHDB submits data representing a range of ‘typical’ UK farms into an international benchmark database. This enables us to compare and analyse how, on average, UK production of key cash crops compares to the main producers and competitors around the world.
- Three farms located in Scotland, Suffolk and Cambridgeshire
- Typical production systems including a variation of no-till, min-till and conventional methods
- UK farm sizes vary from 270 ha to 810 ha
This report, the first of a series, will focus on inputs, including fertiliser, seed, and crop protection costs. These input costs are typical for each nation and include a mix of feed and milling wheat data. The countries included have been chosen due to either having a similar production system to the UK or being a major global wheat producer. These countries include Argentina, Canada, Germany, Denmark, Spain, France, Ukraine, UK, and US. So, how do we compare?
Fertiliser
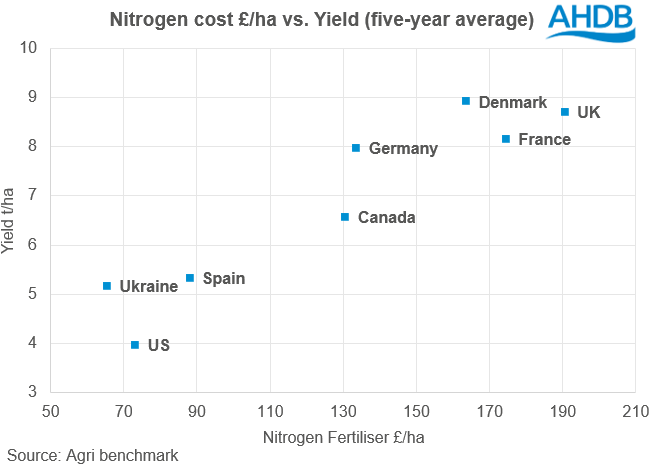
The cost of nitrogen on a £/ha basis for harvest 2022 for UK wheat production was the highest out of all countries in this analysis at £366.48/ha. This is also the case when looking at the five-year average (2018-2022). However, in £ per harvested tonne, the nitrogen cost for harvest 2022 was £40.93/t, the second highest after Argentina, but close (within £5/t) to Canada, Spain, France, and the US. The two countries with the lowest £/t nitrogen cost in 2022 were Ukraine (£23.00/t) and Germany (£29.71/t).
With the conflict in Ukraine commencing in the harvest 2022 growing season, it’s possible that nitrogen applications were missed, and data is slightly distorted for this year. Anecdotal reports suggest that Germany’s lower prices could be explained by the comparatively substantial use of organic fertilisers, especially on farms with close proximity to livestock-dense areas.
Comparatively higher costs in the UK show the exposure of domestic fertiliser markets to global price movements. Elevated global prices led to uncertainty over the future of the UK’s two CF industries fertiliser plants during the season, which in turn also contributed to domestic climbs. The UK also experienced an abnormally warm and dry period in the June and July of 2022, with reports of limited nitrogen uptake as a result, which could have contributed to lower yields.
Of course, the UK nitrogen cost in £/t is comparatively lower than in £/ha, due to the generally higher yields the UK achieves. For harvest 2022, the UK farms in this dataset averaged an 8.95 t/ha wheat yield. This is the second highest of the analysed countries behind Denmark; this is also the case on a five-year average basis. The results of the analysis show a clear correlation between yield and fertiliser cost, proving the UK crop is a high input but also high output system.

In terms of the total fertiliser cost, at £56.85/t, the UK in 2022, was relatively in line with Canada (£54.19/t), but well below Argentina, Spain and the US. This suggests that the UK’s cost of and use of nitrogen in particular is comparatively higher, though our use of phosphorus and potash makes up a smaller percentage of total fertiliser costs than elsewhere in the world.
Seed
Seed costs make up a relatively small proportion of variable crop costs, though there is high variability between the countries in terms of £/ha spend. The UK shows a fairly high spend, at £73.61/ha on average over the five years, which is the second highest country after Canada (£110.03/ha). However, as with crop protection and fertiliser, this cost is diluted by the high yields being achieved, to £8.47/t, putting the UK’s seed cost into the lower half of the comparison. Seed costs appear to be much less volatile within the UK than fertiliser, though where domestic seed supply is affected, prices and dependency on imports may change.
Crop Protection
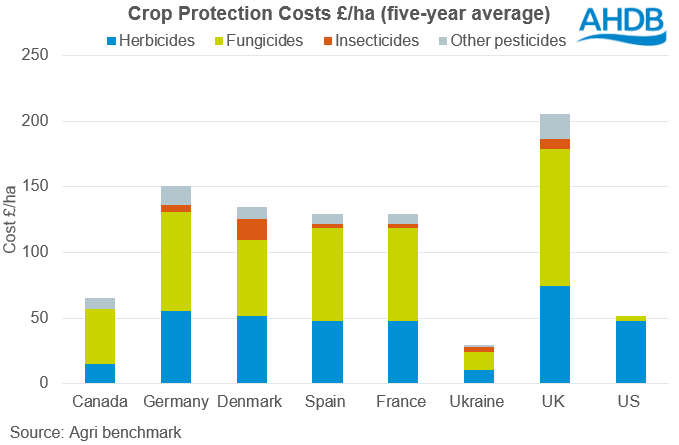
The UK wheat crop consistently has a significantly higher crop protection spend in £/ha than other countries in this comparison, spending £205/ha on average over the five years. Fungicide costs on average make up 51% of the UK spend, while for all countries included in the analysis, this typically only made up for 46% of total spend. On average, the UK spent £29.68/ha more on fungicides than the second highest country, Germany, and £49.93/ha more than the average of all the countries.

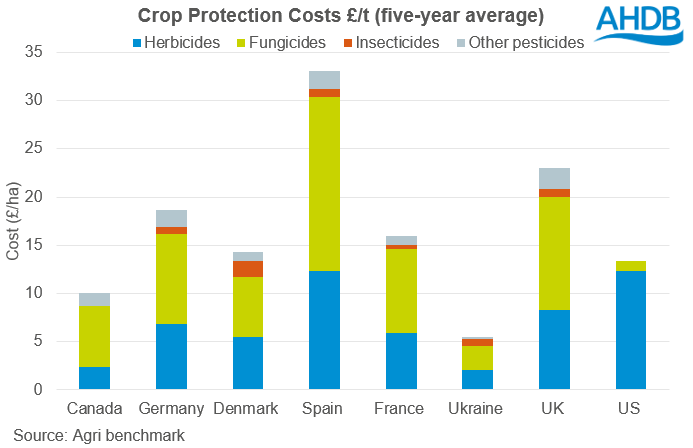
Our wet climate seems a likely reason for the high fungicide spend. However, Denmark, a country which has a similar average rainfall, spent £46.29/ha less on fungicides. Anecdotal reports suggest the reason for this is that producers often apply 25-50% of the manufacturers recommendation, as research suggests this offers the best value for money in terms of protection within Danish systems. Spain showed a surprisingly high crop protection use in £/t. This is significantly affected by the lower yields, which the country has experienced in recent years. The Spanish data averages results from irrigated and rainfed type farms; the former with much higher crop protection spends than the latter.

As with fertiliser and seed costs, the UK’s crop protection spend for wheat is justified by the high yields which are achieved. It results in comparable £/t spends on wheat to the main producers and competitors globally.
Sign up to receive the latest information from AHDB.
While AHDB seeks to ensure that the information contained on this webpage is accurate at the time of publication, no warranty is given in respect of the information and data provided. You are responsible for how you use the information. To the maximum extent permitted by law, AHDB accepts no liability for loss, damage or injury howsoever caused or suffered (including that caused by negligence) directly or indirectly in relation to the information or data provided in this publication.
All intellectual property rights in the information and data on this webpage belong to or are licensed by AHDB. You are authorised to use such information for your internal business purposes only and you must not provide this information to any other third parties, including further publication of the information, or for commercial gain in any way whatsoever without the prior written permission of AHDB for each third party disclosure, publication or commercial arrangement. For more information, please see our Terms of Use and Privacy Notice or contact the Director of Corporate Affairs at info@ahdb.org.uk © Agriculture and Horticulture Development Board. All rights reserved.


