Farmbench: Traits of a top performer
Thursday, 1 February 2024
Farmers benefit from sharing experiences and seeing how other farm businesses succeed. Here, we look at the traits that bring success, and review the data for Beef & Lamb enterprises in England in 2021/22.
Are you optimising your performance?
Many farmers are not aware that collecting and sharing their data can help them discover which parts of the business are the most and least profitable. Farmbench is an online benchmarking tool that enables you to compare your farm to similar businesses.
When farms across the country participate in data sharing, it benefits everyone. The importance of benchmarking was underlined in AHDB’s 2022 Shape the Future vote, when the Beef & Lamb Sector Council and our levy payers confirmed the need for a representative dataset of English producers’ financial and physical performance. The Farmbench tool achieves this, and we hope this article will show why it makes sense to participate.
The eight characteristics of top-performing farms
Through reviewing data from farms in England, we have been able to identify why some succeed more than others. The points below are from a 2018 study, and much of the information is just as relevant today.
Eight management practices that differentiate the top-performing farms from the rest:
- Minimise overhead costs.
- Set goals and budgets.
- Compare yourself with others and gather information.
- Understand the market.
- Focus on detail.
- Have a mindset for change and innovation.
- Continually improve people management.
- Specialise.
The importance of these factors varies for each farm business according to the system, environment, resources and performance. Which areas do you need to focus on?
For more about the eight traits and case studies, read the full study below.
A closer look at the data
To give an idea of the information captured on Farmbench and how it can help your business, we have delved into our benchmarking data for the 2021/22 production year for Beef & Lamb enterprises across England. A total of 96 farms' data were used.
A ‘production year’ means a 12-month period which covers all financial and physical activity relating to the production of the annual crop (plant or animal) from an enterprise.
All the data are averaged into three benchmark groups ranked by net profit margin: top 25%, middle 50% and bottom 25%.
Beef enterprises
Below, we analysed suckler herd data gathered for the 2021/22 production year.
Table 1. Suckler herd cost of production and related factors – data gathered from 58 farms in England, 2021/22
| Factor measured | Top 25% | Middle 50% | Bottom 25% |
|---|---|---|---|
| Age at first calving (months) | 24 | 26 | 31 |
| Number of cows/heifers put to bull | 150 | 73 | 46 |
| Calf losses from birth to weaning (% of born alive) | 2.09 | 2.88 | 4.34 |
| Daily liveweight gain for weaned calves (kg/day) | 1.11 | 1.04 | 0.88 |
| Cost of production per calf (£/kg) | 2.29 | 3.83 | 7.32 |
Source: Farmbench
Table 1 indicates large variations among farms across the five factors shown.
The top 25% of farmers typically calved at 24 months. Those calving nearer the 30-month mark experienced higher calf losses from birth to weaning and a lower daily liveweight gain for weaned calves.
The fifth of the eight characteristics, ‘Focus on detail’, mentioned earlier, indicates that small changes can make a big difference. The data in Table 1 shows that farmers might improve their efficiency by tightening their calving interval..
The bottom 25% spent over three times more to produce a calf than those in the top 25%. Considering the volatility of beef prices, these costs leave little or no margins for farmers. There are many options to consider when rearing calves, and striking the balance between efficient production and controlling costs can be a challenge.
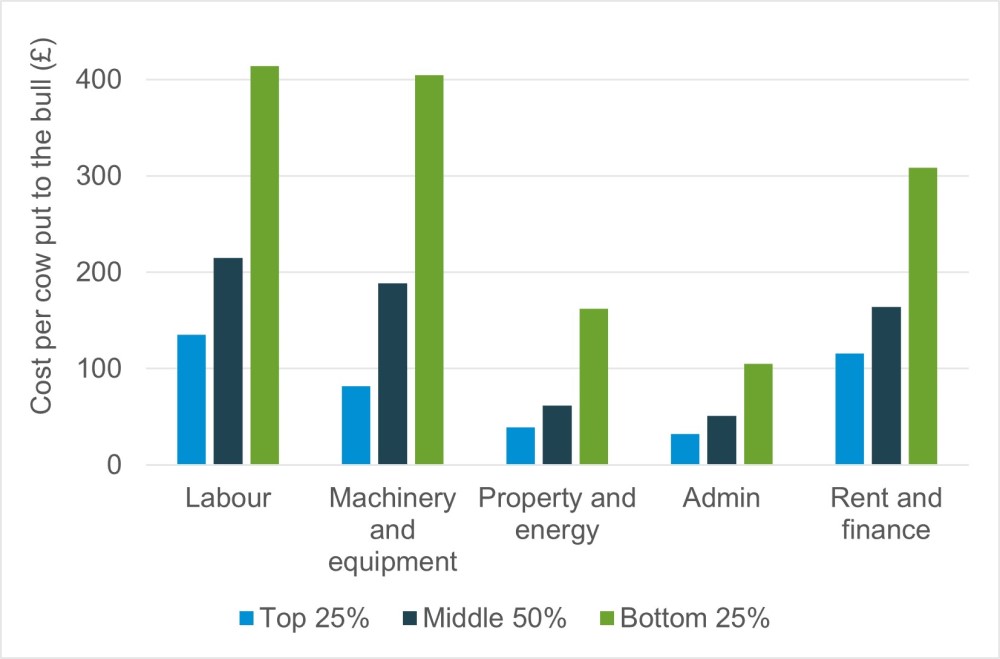
Figure 1. Suckler herd costs – data gathered from 58 farms in England, 2021/22

Source: Farmbench
The first characteristic ‘Minimising overhead costs’ is relevant here, as shown in Figure 1. Farmbench data shows clear differences between the top 25%, middle 50% and bottom 25% across the five areas of expenditure.
Some possible steps to reduce overheads:
- Renew your machinery replacement policy; when was it last reassessed?
- Calculate which overheads you can remove if you stop any individual enterprise
- Cancel any subscriptions you have not used or read for the last 12 months
- Negotiate your borrowing rate; check with other banks that you are paying a low rate
Lamb enterprises
Farmbench data for lamb enterprises in the 2021/22 production year show a similar trend to the beef enterprises above.
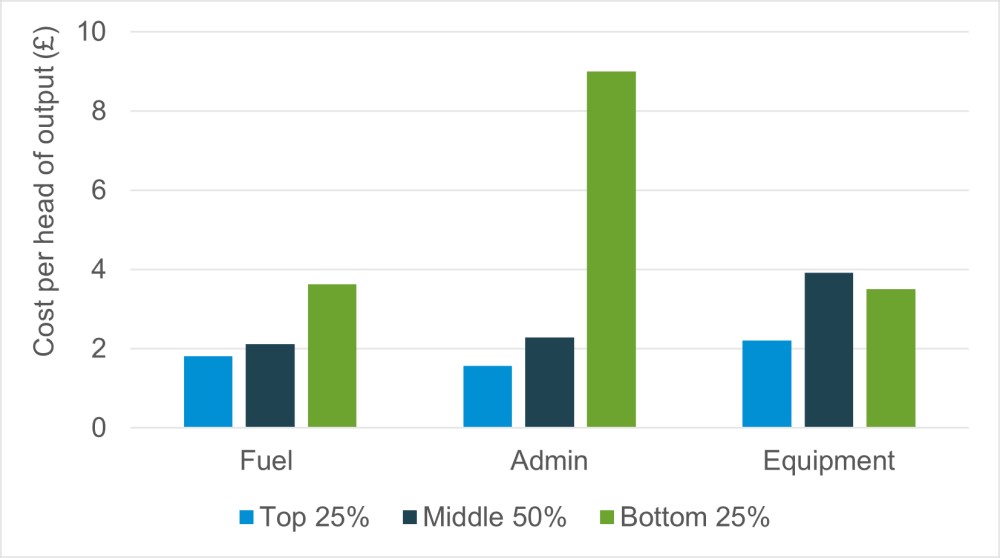
Figure 2. Lamb costs – data gathered from 38 farms in England, 2021/22

Source: Farmbench
The data in Figure 2 shows a clear trend of higher costs incurred by the bottom-performing farms compared to the top performers. And the greater the total spend, the lower the net margin will likely be.
By comparing your business’s expenditure to the national benchmarks, you might consider whether it is more economical to contract out work, make fewer car journeys or cancel a few subscriptions to reduce your cost of production.
Farmbench data often displays interesting and sometimes unexpected results. Table 2 shows that for the 2021/22 production year, there was no correlation between the average weight of finished lambs and the net profit margin for lamb-finishing enterprises. In fact, the bottom 25% had the highest liveweight of finished lambs on average.
Table 2. Lamb data gathered from 38 farms in England, 2021/22
| Factor measured | Top 25% | Middle 50% | Bottom 25% |
|---|---|---|---|
| Liveweight per finished lamb (kg/hd) | 41.97 | 40.63 | 44.40 |
| Value of finished lambs (£/kg) | 2.90 | 2.37 | 2.25 |
Source: Farmbench
Instead, the difference in net margin was driven by achieving a higher value per kilogram of finished lambs. Was this because the top performers are calculating the best time to sell, or perhaps producing higher-quality carcases?
Understanding these differences forms part of the discussions in the Business Improvement Group meetings the Farmbench team run, at which farmers can evaluate their production and finances as a group and learn from each other.
Conclusion
When evaluating your management practices, the eight characteristics identified in our 2018 study are a good place to start.
While Farmbench links into all these traits, it is particularly valuable for providing a detailed breakdown of your business expenditure, which will help you understand and minimise your costs and identify manageable goals and budgets.
It is important to measure in order to manage.
To come on board, contact your regional Farmbench manager. They will come to your farm, collect the information required and upload it for you. Your personal data will never be shared, and we will only use your business data with your permission. Your data are also validated by AHDB before being included anonymously in comparative aggregated benchmarks.
Einstein defined insanity as “doing the same thing over and over again and expecting different results”. We hope you will take up this invitation to start doing things differently and seeing how you can benefit from Farmbench.
More Farmbench articles in early 2024
This is the second of a series of articles our Farmbench managers and livestock market specialists will publish over the next few months on what the top performers do and the benefits of knowing your cost of production. They will delve into the data collected in 2022 and give an insight on how breeding flock and suckler herd enterprises are performing.
Previous article: With rises in feed, fertiliser and fuel costs, is it time for you to get involved with Farmbench?

