UK yogurt trade deficit increases
Thursday, 18 March 2021
By Bronwyn Magee
As of January 2021 data, the way HMRC collects trade data has changed, which will be reflected in the trade statistics. Comparisons between this and historic data should be treated with caution, and may well be subject to future revision.
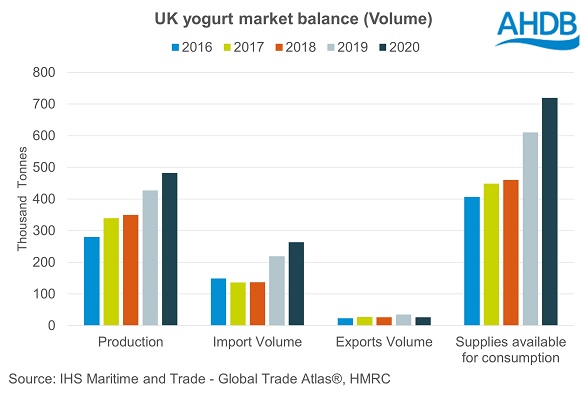
The UK trade surplus for all dairy products[1] fell in 2020. A large part of this was the increase in the trade deficit of yogurt, which grew by 54k tonnes (29%) to reach 237k tonnes in 2020[2]. This is largest trade deficit for yogurt seen in at least the last five years.
UK imports of yogurt lifted 20% (45k tonnes) year-on-year in 2020. Accounting for most of this increase were shipments from France, rising 24k tonnes (+33%). Further increases were seen in imports from Belgium and Germany, up 23% (10k tonnes) and 15% (8k tonnes) respectively. This trend has continued into the start of the new year, with imports lifting 4% (1k tonnes) when compared to January 2020.
Meanwhile, annual UK exports of yogurt declined 25% on the year, totalling 27k tonnes in 2020, with the majority of these destined for Ireland. Looking at the most recent data, export volumes continued to fall in January, down 64% (1K tonnes) year-on-year, although this is likely to be in reaction to trade issues associated with Brexit. As such, higher imports combined with reduced export volumes worsened the UK yogurt net trade position in 2020.

At the same time, UK production of yogurt lifted up 13% in 2020 (56k tonnes) to total 483k tonnes, according to Defra. Combined with the higher imports, yogurt supplies available for consumption increased by approximately 18% in 2020[3].
According to Kantar, yogurt retail volumes grew 7% (44k tonnes) in the year to January[4], which are lower than what we’ve seen in most other dairy products. The majority of growth came from sales of big pot plain yogurt. It seems more time spend at home in the past year has increased demand for yogurt, particularly for use as an ingredient in meal preparation. On the other hand, the loss of takeout lunch occasions has perhaps limited sales growth in the year.
Sign up to receive the latest information from AHDB.
While AHDB seeks to ensure that the information contained on this webpage is accurate at the time of publication, no warranty is given in respect of the information and data provided. You are responsible for how you use the information. To the maximum extent permitted by law, AHDB accepts no liability for loss, damage or injury howsoever caused or suffered (including that caused by negligence) directly or indirectly in relation to the information or data provided in this publication.
All intellectual property rights in the information and data on this webpage belong to or are licensed by AHDB. You are authorised to use such information for your internal business purposes only and you must not provide this information to any other third parties, including further publication of the information, or for commercial gain in any way whatsoever without the prior written permission of AHDB for each third party disclosure, publication or commercial arrangement. For more information, please see our Terms of Use and Privacy Notice or contact the Director of Corporate Affairs at info@ahdb.org.uk © Agriculture and Horticulture Development Board. All rights reserved.

