How have wheat net margins fared over the past five years? Grain market daily
Friday, 24 May 2024
Market commentary
- UK feed wheat futures (Nov-24) fell £1.05/t yesterday, ending the session at £219.20/t, and tracking movement in European wheat markets
- Following a rally over the last few weeks, markets have stalled slightly as they continue to assess rain forecasts in top exporter Russia, as well as monitor damp conditions in western Europe. The International Grains Council yesterday cut its global wheat and maize production figures. Total wheat production was revised down 3.2 Mt to 794.5 Mt, with maize revised down 5.7 Mt to 1.22 Bt
- Nov-24 Paris rapeseed futures closed at €502.75/t yesterday, gaining €6.50/t on Wednesday’s close
- Despite losses in US soya bean markets, Paris rapeseed gained yesterday following further reductions to the German crop. Germany’s association of farm cooperatives said yesterday that the country’s rapeseed crop would be down 8.4% on the year at 3.87 Mt for harvest '24 (LSEG)
How have wheat net margins fared over the past five years?
With significant price fluctuations over the last few years, and increasing costs, how have net margins for UK wheat farmers been impacted?
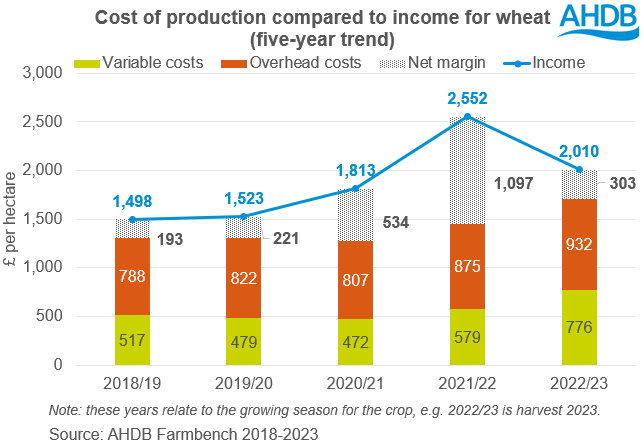
The graph below shows the average variable cost, overhead cost, income and net margin per hectare over the past five production years for wheat crops. Please note that these years relate to the growing season for the crop and not the marketing season, e.g. 2022/23 is the production year for crops harvested in 2023.
The data is taken from Farmbench, AHDB’s benchmarking tool, and each year is calculated from a minimum of 400 wheat enterprises from across the UK.

The production year 2021/22 (harvest 2022) stands out as exceptional, with strong market prices driving a high total income per hectare of £2,552, resulting in an average net margin of £1,097/ha. Prices during that time were particularly high as tight global wheat supplies were compounded by the start of the war in Ukraine.
Prices have since dropped, with a corresponding drop in income per hectare. This returned net margins in 2022/23 (harvest 2023) to the same level as seen in 2018/19 (harvest 2019) and 2019/20 (harvest 2020), at around 15% of total income.
However, there is an underlying trend of increasing variable and overhead costs over the last three years. This has led to concerns over a possible squeeze on net margins in the coming seasons.
Most of the increase in variable costs is due to rising costs of fertiliser and, to a lesser extent, crop protection products. For example, the average cost of fertiliser for wheat crops grown in 2022/23 (harvest 2023) was £432/ha, compared with an average of £226/ha over the four previous years – a 90% increase.
The rising overhead costs come from a broader range of categories, including labour, machinery and equipment, and property and energy. These increased by an average of around 20% over the five-year period. It is important to note here that these figures show the full economic net margin, which includes imputed costs, such as family labour and rental equivalent on owned land.
While spot fertiliser prices have eased over the past 12 months, they remain above the levels seen before the Ukrainian war. Other costs, such as the cost of borrowing and fuel, also remain higher. New-season fertiliser prices are usually released in May/June. Against this backdrop, knowing your full cost of production is more important than ever for maintaining net margins. Analysing your business and knowing what it costs to grow each crop in your rotation can also help when marketing your crop. It is difficult to know what a ‘good sale price’ is without knowing the true cost of production.
Using Farmbench, you can compare your variable and overhead costs to similar businesses and identify your strengths and weaknesses. This can enable you to target cost-reduction strategies to areas with the greatest opportunities for improvement. For example, would you benefit most from reviewing your fertiliser application strategy or considering the costs of using contractors versus your own machinery or machinery sharing?
For information or to get involved, contact our team of Farmbench managers.
Sign up for regular updates
You can subscribe to receive Grain Market Daily straight to your inbox. Simply fill in your contact details on our online form and select the information you wish to receive.
While AHDB seeks to ensure that the information contained on this webpage is accurate at the time of publication, no warranty is given in respect of the information and data provided. You are responsible for how you use the information. To the maximum extent permitted by law, AHDB accepts no liability for loss, damage or injury howsoever caused or suffered (including that caused by negligence) directly or indirectly in relation to the information or data provided in this publication.
All intellectual property rights in the information and data on this webpage belong to or are licensed by AHDB. You are authorised to use such information for your internal business purposes only and you must not provide this information to any other third parties, including further publication of the information, or for commercial gain in any way whatsoever without the prior written permission of AHDB for each third party disclosure, publication or commercial arrangement. For more information, please see our Terms of Use and Privacy Notice or contact the Director of Corporate Affairs at info@ahdb.org.uk © Agriculture and Horticulture Development Board. All rights reserved.


