Asia: How much do they consume?

According to the latest OECD/FAO agricultural outlook, the largest absolute increase in meat consumption out to 2035 is forecast for Asian countries. Emerging trends in dairy product consumption also hold promise for UK exports.

Pork

Asia is the world’s leading pork-consuming region. Demand remains strong due to the deep cultural integration of pork into local cuisines and the growth of the middle classes.

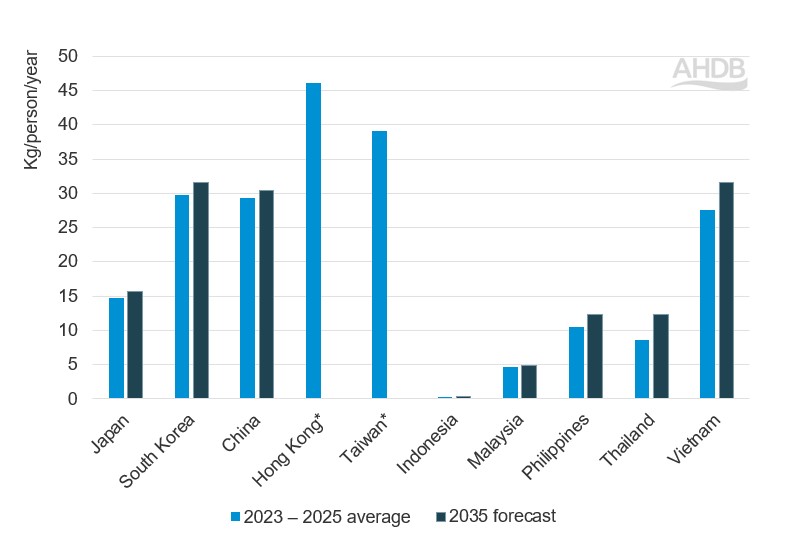
Figure 1 shows pork consumption per capita in a selection of Asian countries.

Data for Hong Kong and Taiwan is from the Food and Agriculture Organization (FAO) database, where the latest data is from 2023 and a forecast is not available. Per capita consumption data and forecasts for the rest of the countries in Figure 1 are from the OECD/FAO Agricultural Outlook 2026.

Hong Kong and Taiwan (Republic of China) had the highest pork consumption per capita in 2023 at 46 kg and 39 kg per person per year, respectively.

South Korea, China and Vietnam are also big pork consumers. Further growth is forecast out to 2035, especially in Vietnam (14% higher compared with the 2023–2025 average). Per capita pork consumption in the Philippines is projected to increase by 18% over the same period to reach 12.4 kg per person per year.

Figure 1. Pork consumption per capita in selected Asian countries (kg/person/year)

Bar graph showing pork consumption per capita in selected Asian countries, 2023-25 and 2035 f'cast.

*Hong Kong and Taiwan figures are for 2023 (FAO), as 2025 figures and forecast are not available from OECD.

Source: OECD, FAO

China, Japan, South Korea and the Philippines are net pig meat importers, and this is forecast to continue until 2035.

According to the OECD's forecast, China’s pig meat imports are expected to decline by around 23% to 1.3 million tonnes (Mt) by 2035 compared with the 2023–2025 average as the country looks to strengthen its domestic production.

Japan’s pig meat imports are also forecast to fall: from 1.3 Mt (2023–2025 average) to 1.2 Mt in 2035 (−4.5%). By contrast, South Korea’s pork imports are expected to rise by almost 8% over the same timeframe.

The majority of pig meat imported by China is frozen. The main exporters of pig meat to China are Spain and Brazil. Vietnam also mainly buys frozen pork, with Brazil and Russia being its main suppliers.

Japan is the main buyer of more expensive fresh and chilled pig meat in Asia, with Canada and the USA being the main suppliers. Spain is the top exporter of frozen products to Japan.

China imported around 1 Mt of pork offal per year, based on the 2023–2025 average, mainly from the USA, Spain and other EU countries (Trade Data Monitor LLC).

The Philippines is another major importer of offal, averaging more than 270,000 tonnes (Kt) a year between 2023 and 2025; most supplies came from Spain, the USA, the Netherlands and Canada.

Another important pork offal importer in Asia is Vietnam. Imports averaged around 140 Kt per year between 2023 and 2025, mainly from Russia and Germany.

Beef

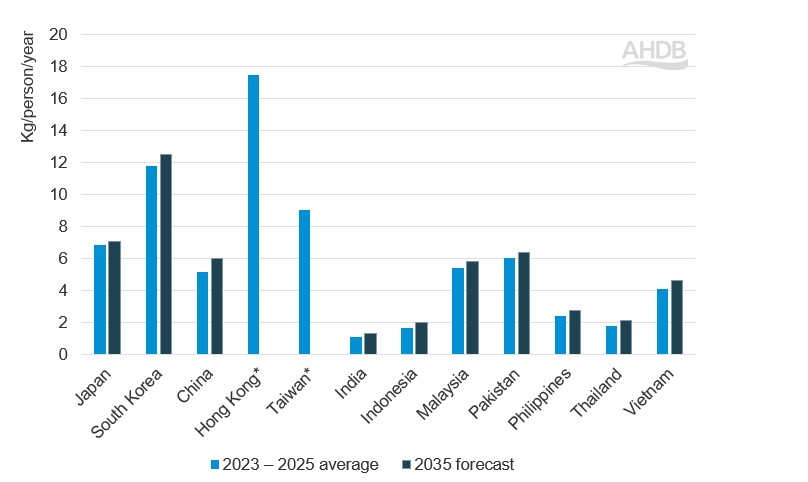
Beef is a widely consumed red meat in Asia, with the highest consumption per capita in Hong Kong, South Korea and Taiwan (Republic of China), as shown in Figure 2.

The FAO estimates beef consumption per capita in Hong Kong in 2023 as 17.4 kg per person, which is considerably higher than in other Asian countries.

Figure 2. Beef consumption per capita in selected Asian countries (kg/person/year)

Bar graph showing beef consumption per capita in selected Asian countries, 2023-25 and 2035 f'cast.

*Hong Kong and Taiwan figures are for 2023 (FAO) as 2025 figures and forecast are not available from OECD.

Source: OECD, FAO

All of the countries shown in Figure 2, for which forecast data is available, are expected to see an increase in beef consumption per capita over the coming decade. Per capita consumption is projected to increase by 5.7% in South Korea, 16.7% in China and 13.4% in Vietnam.

Asia's share of global beef and veal imports remains stable at around 61% (2023–2025 average).

According to the OECD's forecast, China’s beef imports are predicted to reach 4.1 Mt in 2035, up from 3.6 Mt compared with the 2023–2025 average.

Indonesia’s beef imports are projected to increase by almost a third to 573 Kt over the same period, while Vietnamese imports are expected to be 23% higher to reach 371 Kt.

Most of China’s beef imports are frozen and come from Brazil (around 50%), Argentina and Australia. Japan and South Korea import a higher proportion of fresh or chilled beef; Australia and the USA are the main suppliers.

The main cuts China imports are beef shank and brisket. Beef shank is predominantly used in foodservice and home cooking, while brisket is used mainly in hotpots (broths traditionally served in large metal pots) and fast-food restaurants.

Beef shoulder cuts are also a popular Chinese import, used in foodservice and for further processing. Beef trimmings are another popular product; they are processed further or used in hotpots.

Hong Kong is a major importer of bovine offal in Asia, with imports averaging 196 Kt per year between 2023 and 2025. The main supplier is Brazil, accounting for more than half of Hong Kong’s beef offal imports.

Hong Kong mainly imports frozen bovine offal. Unlike other markets where beef offal imports closely track domestic consumption, Hong Kong’s high reported consumption per capita levels are partly structural, driven by re-exports to surrounding countries rather than end use demand within the territory.

Japan’s average bovine offal imports were over 83 Kt per year, between 2023 and 2025; most of this was fresh or chilled and mainly sourced from the USA and Australia.

Another important importer of bovine offal is Vietnam, with average imports of around 77 Kt per year (2023–2025 average).

Japan and Indonesia are major buyers of beef tongues, importing an average of more than 25 Kt each per year (2023–2025 average).

Sheep meat

Consumption of sheep meat in Asia is markedly lower than that of pork and beef.

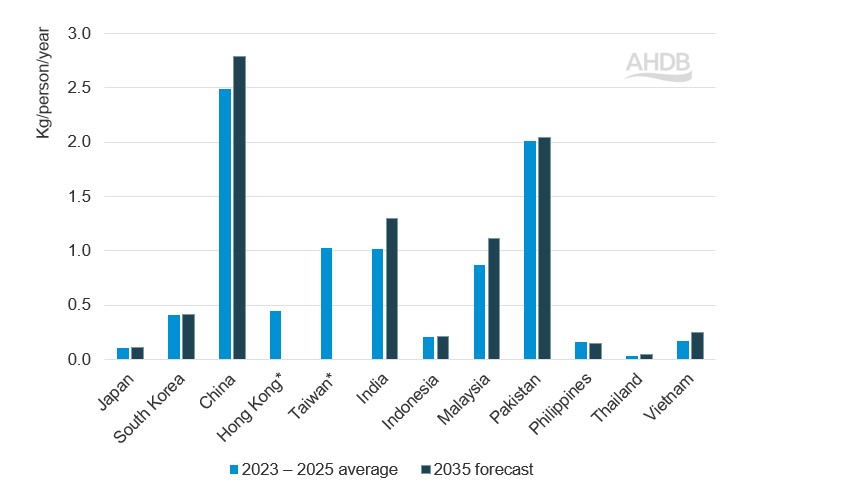
China and Pakistan have the highest per capita consumption in the region, based on OECD data; this is expected to increase by 12% and 1.7%, respectively, by 2035 (Figure 3).

Figure 3. Sheep meat consumption per capita in selected Asian countries (kg/person/year)

Bar graph showing lamb consumption per capita in selected Asian countries, 2023-25 and 2035 f'cast.

*Hong Kong and Taiwan figures are for 2023 (FAO) as 2025 figures and forecast are not available from OECD.

Source: OECD, FAO

Sheep meat consumption in Malaysia and India is expected to increase by 29% and 28%, respectively, by 2035 compared with the 2023–2025 average.

India’s imports of sheep meat, however, are expected to be stable over the coming decade due to a 31% increase in production by 2035 compared with the 2023–2025 average.

China accounts for the lion's share of Asia's sheep meat imports.

In recent years, Pakistan’s domestic production of sheep meat has remained above consumption levels, and so the country has not had to rely on imports. This trend is forecast to continue out to 2035.

Indonesia’s sheep meat imports are forecast to increase almost fivefold to 27 Kt by 2035 compared with the 2023–2025 average, while Malaysian sheep meat imports are projected to increase by 49% to 66 Kt over the same period.

Australia and New Zealand are the main suppliers of sheep meat to the Asian market.

While most Asian countries import frozen sheep meat, Japan and South Korea are key importers of fresh/chilled sheep meat.

Due to its high-quality protein content, sheep meat has the potential to increase in popularity in Asia. Incorporating healthy food items into daily diets and an increasing demand for ready-to-cook food products among millennials could support market growth (Expert Market Research).

Poultry and fish

Poultry

Poultry meat is widely consumed in Asia, competing with red meat for market share.

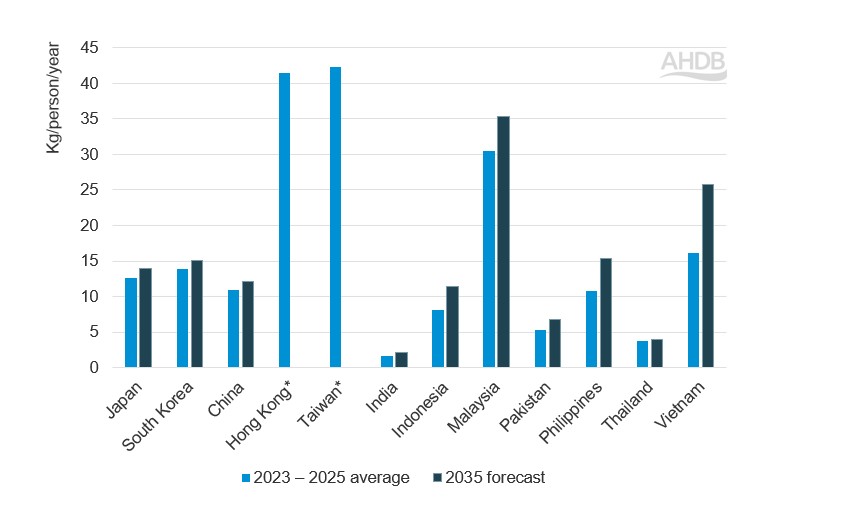
Figure 4 shows that Hong Kong, Taiwan (Republic of China) and Malaysia are the leading poultry consumers in Asia on a per capita basis.

Figure 4. Poultry meat consumption per capita in selected Asian countries (kg/person/year)

Bar graph showing poultry consumption per capita in selected Asian countries, 2023-25 and 2035.

*Hong Kong and Taiwan figures are for 2023 (FAO) as 2025 figures and forecast are not available from OECD.

Source: OECD, FAO

Vietnam’s poultry consumption per capita is forecast to increase by almost 60% by 2035 compared with the 2023–2025 average of 16.2 kg/person/year. Per capita consumption in Malaysia and the Philippines is expected to increase by 41% over the same timeframe.

The largest poultry meat importers in Asia are China and Japan.

China’s poultry imports are forecast to decline by 20% to 870 Kt by 2035 compared with the 2023–2025 average, while Japanese poultry imports are expected to increase by 8% to 1 Mt.

The Philippines are also a key poultry importer in the region and are forecast to import 870 Kt of poultry meat in 2035 (67% higher than the 2023–2025 average).

Fish

Fish is an important part of the Asian diet, competing with meat.

Per capita fish consumption in Malaysia and South Korea is 55 and 54 kg/person/year, respectively.

China, Japan, Indonesia and Vietnam also have high per capita consumption levels (40–50 kg/person/year) compared with the 2023–2025 global average (21 kg/person/year).

With the exception of Malaysia, per capita fish consumption is expected to increase in all of these countries by 2035.

Dairy

Globally, Asia has the highest consumption of fresh dairy products, such as milk. Consumption of processed dairy products, however, such as cheese, yogurt and butter, lags behind Europe and North America.

This reflects a structurally limited domestic production base for processed dairy products in many Asian countries, resulting in reliance on imports even at low consumption levels.

There are some exceptions. As the world's largest milk producer, India is self-sufficient in milk production, has a strong dairy industry, and dairy products play an important role in most local households.

The Indian government views dairy farmers as a core part of their voting base and have invested heavily in rejuvenating the sector. Pakistan is also a major dairy producer in the region.

Pakistan and India’s per capita consumption of butter/ghee[1] is comparable to that in Europe and North America and is above the world average.

But both of these countries are able to satisfy the majority of demand for butter/ghee from domestic production. Opportunities for UK dairy imports to Pakistan and India, even with the UK–India Free Trade Agreement, are limited.

The top destination in Asia for UK butter exports (2023–2025 average) is China (£1.25 million), followed by Singapore (£0.54 million) and South Korea (£0.43 million).

The majority of UK milk powder exports to Asia are to Pakistan (2023–2025 average) at an average value of £9.7 million per year, with China (£3.0 million) and Indonesia (£2.8 million) in second and third place, respectively.

The top three destinations for UK cheese exports in Asia (based on the 2023–2025 average) are China (£6.54 million), Hong Kong (£6.48 million) and Singapore (£3.35 million).

Japan and South Korea’s average per capita cheese consumption between 2023 and 2025 (3.2 kg/person/year and 3.6 kg/person/year, respectively) is slightly above the global average of 3.1 kg/person/year.

Japan’s per capita consumption levels are forecast to increase by 22% in 2035, while South Korea’s per capita consumption of cheese is expected to rise by 9%. Both countries rely on imports to satisfy domestic demand.

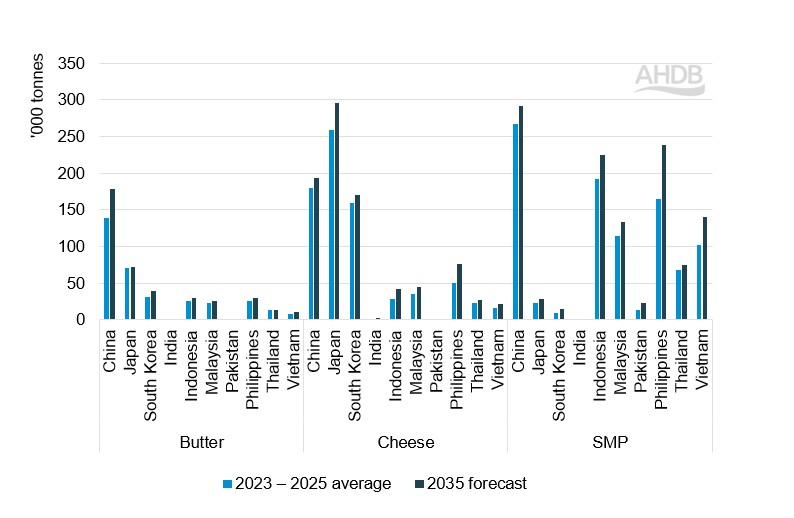
Figure 5 shows current dairy product imports in a selection of Asian markets as well as projected import levels in 2035.

Figure 5. Dairy product imports in selected Asian countries ('000 tonnes)

Bar graph showing dairy product imports in selected Asian countries. 2023-25 and 2035.

Source: OECD/FAO

Japan, China and South Korea are leading cheese importers in the region, with imports expected to increase further by 2035. By then Japan’s cheese imports are projected to rise by 14% compared with the 2023–2025 average, and South Korea’s by 7%.  

Mild, low‑salt cheeses – such as mozzarella, cream cheese and mild processed varieties – are the main drivers behind this import growth, reflecting preferences for subtle, creamy flavours. Strongly aged or highly salty cheeses remain niche, largely limited to premium retail.

Processed cheese has become a favoured snacking option in South Korea, and demand is climbing not only among everyday consumers but also within the food manufacturing industry.

Cream products are also an important growth area, driven by South Korea’s strong cafe and bakery culture. High-fat cream is widely used in pastries, cakes and desserts there. As domestic production is limited, demand is largely met through imports.

Frozen cream is widely used by industrial bakeries and foodservice operators to ensure consistent quality and year-round availability.

In 2026, retail e-commerce has been the main retail channel for dairy products in South Korea, responsible for almost a quarter of retail sales (Euromonitor International, Dairy Products and Alternatives in South Korea, Country Report, October 2026). The country’s advanced cold chain infrastructure is a big advantage in this respect.

Retail e-commerce also has a larger variety of dairy products and makes it easier for consumers to purchase premium and specialised dairy products.

Hypermarkets and supermarkets remain important channels, though, accounting for 20% and 17% of sales, respectively. Department stores are also a large and important channel for dairy product distribution.

China is the top importer of butter and skimmed milk powder (SMP) out of the countries shown in Figure 5 and is the second-largest cheese importer.

Cheese imports into China are largely driven by use in the foodservice and food processing industries (for example, in pizzas, bakery products and ready-to-eat foods) rather than for standalone consumption. Most of China’s dairy product imports originate from New Zealand.

Following China, the region's other major SMP importers include Indonesia, the Philippines, Vietnam and Malaysia.

The largest growth in SMP imports (in absolute terms) for the countries shown in Figure 5 is for the Philippines, where imports are forecast to increase by 73 Kt (44%) in 2035 compared with the 2023–2025 average to reach 238 Kt.

China’s SMP imports are projected to grow by 9% over the same period, with Indonesian and Malaysian imports forecast to rise by 17% and 16%, respectively.

Forecasts suggest that SMP imports to China and Japan could decrease by 4% by 2035. However, South Korea, Vietnam, the Philippines, Indonesia and Malaysia could see respective increases of 60%, 32%, 29%, 22% and 11%. The main origins of SMP imports to these countries are the USA, New Zealand and the EU.

Milk powders in Asia are primarily used for processing due to limited local supply. However, some are consumed directly as a practical alternative to fresh milk, thanks to their long shelf life and the limited availability of cold chain infrastructure.

Hong Kong and Singapore are considered as gateways to the Asian market. As advanced economies within the region, both are promising markets for premium dairy products.

Milk powder is the main dairy product imported in value terms: it accounts for 61% of dairy imports in Hong Kong and 39% in Singapore (based on the 2023–2025 average).

Cheese and butter comprise 11% and 8% of dairy imports, respectively, by value in Hong Kong. In Singapore, cheese accounts for 15% of all dairy imports by value (based on the 2023–2025 average), while butter accounts for 10%.

Hong Kong imported an average of 9.7 Kt of yogurt per year between 2023 and 2025 (average value of £28 million per year), representing 4% of total dairy imports by value. Singapore’s yogurt imports over the same period were slightly higher (11.5 Kt), with an average value of £36 million (accounting for 5% of the country’s total dairy imports). 

The EU, China, Australia and Switzerland are the main origins of Hong Kong’s yogurt imports, but the UK has been the fifth-largest source in value terms (based on the 2023–2025 average) due to premium yogurt. This is a considerable achievement despite UK yogurt's shorter shelf-life compared with its competitors, demonstrating the willingness of Hong Kong's consumers to pay more for UK product.  Australia is the top supplier of yogurt to Singapore.

Ice cream is also a key processed dairy product market in Hong Kong and Singapore.

The latest World Integrated Trade Solution (WITS) data shows Hong Kong imported US$57.3 million (around £44.8 million) worth of ice cream in 2024, mainly from France.

Singapore’s ice cream imports in 2024 were worth US$62.8 million (£49.1 million). In value terms, these were mainly from France; in terms of quantity, however, most were from Malaysia and Thailand. 

Taiwan (Republic of China) is also a market to consider. Between 2023 and 2025, Taiwan imported around 219 Kt of dairy products on average, with a value of £607 million. Milk powders comprised 37% dairy imports by value, with cheese and butter accounting for 24% and 16%, respectively.

Globalisation has influenced cheese consumption in Taiwan, with processed cheeses, cream cheese and mozzarella having more prominence. This is partly due to their use in popular and convenient dishes.

Thailand’s dairy imports averaged 284 Kt per year between 2023 and 2025, with an average value of almost £700 million. Milk powders accounted for more than half of all dairy imports, while cheese imports accounted for 8% by volume and 15% by value.

The use of cheese in traditional Thai dishes – such as tom yum, moo ping and stir-fries – has been growing in popularity, especially among young consumers. Mozzarella is widely consumed in Western dishes, such as pizza, with Cheddar and cream cheese in demand for sandwiches/snacks and desserts/baked goods, respectively.

According to Euromonitor International (Cheese in Thailand Country Report September 2025), consumption in everyday cooking and meal preparation would benefit from smaller portion sizes being made available.

Barley

For the past few seasons, China has been the world's largest barley importer. Since 2015 its imports have been between 5 and 14 Mt.

In 2024, China’s barley imports reportedly reached a record high of over 14 Mt, driven by strong domestic demand and the competitive pricing of imported barley relative to other feed grains, including domestic maize.

Feed barley is the main grade of the crop imported by China, with malting barley imports typically at 1‒2 Mt a year.

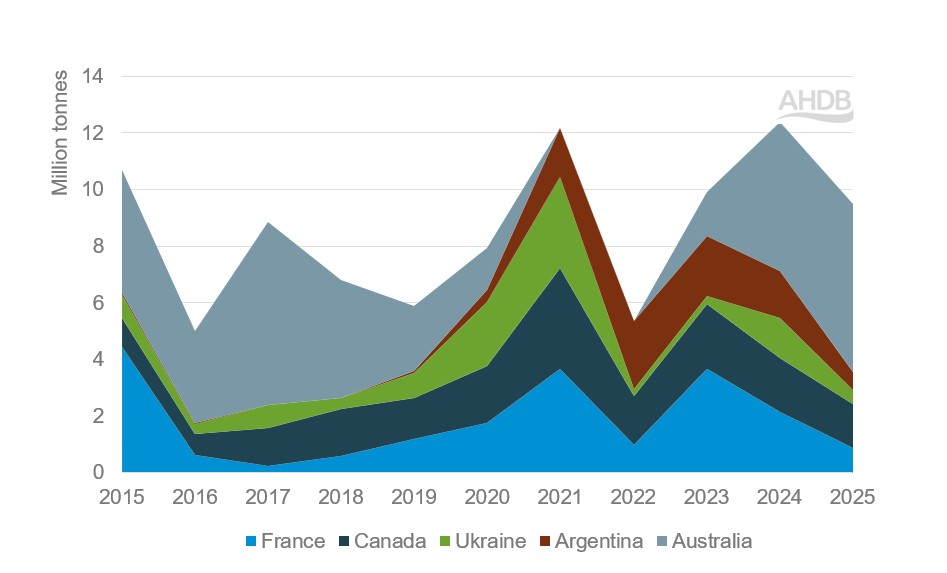
As shown in Figure 6, Australia started exporting barley to China after a three-year break, when China's anti-dumping and anti-subsidy tariffs on Australian barley ended in August 2023.

In the meantime, other suppliers of barley, such as Canada, France, Ukraine and Argentina, have benefited from Australia’s inability to compete for the Chinese market.

Figure 6. Chinese barley imports by country of origin (Mt)

Stacked area chart showing Chinese barley imports by origin, 2015-2025.

Source: China Customs Statistics via Trade Data Monitor LLC

The OECD and FAO do not provide import projections just for barley. The OECD predicts China’s imports of coarse grains (barley, oats sorghum, rye, millet) will decline by 7% by 2035 to 19.7 Mt compared with the 2023–2025 average.

China continues to expand grain and oilseed import suppliers.

The General Administration of Customs of the People's Republic of China (GACC) announced that, starting from August 2025, it will permit imports of Danish barley that meet relevant requirements.

The approved barley must originate from Denmark and be intended for malt processing in China, not for planting purposes.

[1] Ghee is purified butter. OECD/FAO data combines butter, ghee and other fats and oils derived from milk data.

Continue reading about the Asian market

Where the opportunities lie, by country

Economic overview

Market access and barriers to trade

Consumer trends

Routes to market

Prospects for UK agri-food exports: Asia home page

See analysis for other world regions

×