Where does the UK import fertiliser from? Grain market daily
Tuesday, 16 April 2024
Market commentary
- UK feed wheat futures (May-24) closed at £172.55/t yesterday, up £0.80/t from Friday. The Nov-24 contract was relatively unchanged over the same period, up £0.05/t, to end yesterday’s session at £195.10/t.
- Despite pressure in US markets, European wheat prices ended mixed yesterday. Support from a weaker euro was countered by cheaper Black Sea supplies. Traders also said that warm and sunny weather had helped French crops last week, though more rain is forecast across much of France this week (LSEG).
- May-24 Paris rapeseed futures closed yesterday at €460.00/t, gaining €1.00/t over the session. The Nov-24 contract closed at €464.25/t, down €4.75/t over the same period.
- New crop European rapeseed prices followed canola futures down yesterday on the back of ample supplies, as well as lacklustre Canadian exports (LSEG). Weakness in crude oil markets also filtered through to the wider oilseeds complex.
Where does the UK import fertiliser from?
The UK is estimated to produce approximately 40% of its nitrogen fertiliser requirement, while the remaining 60% is relied upon from imports (AIC). In June 2022, CF Fertilisers UK announced the permanent closure for one of their two UK fertiliser plants, though considering wider fertiliser production, Yara have plans for a new fertiliser plant in Yorkshire to be operational producing foliar nutrients by the end of 2025. While increased self-sufficiency would not exclude the UK from the recent volatile global fertiliser market, the lack of self-sufficiency does increase exposure.
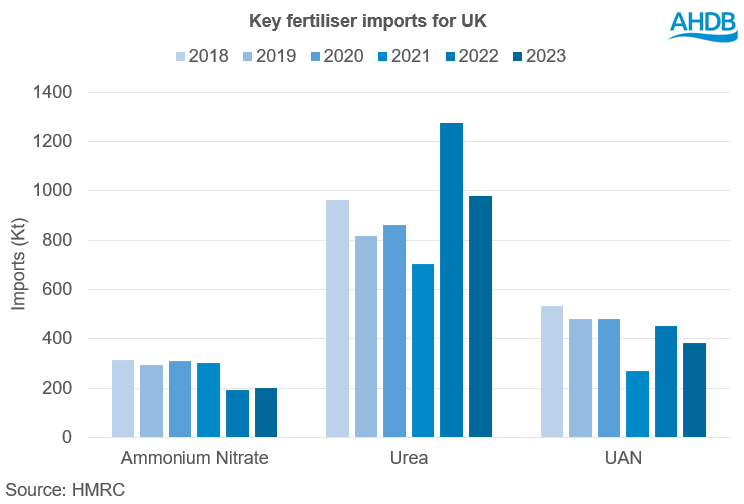
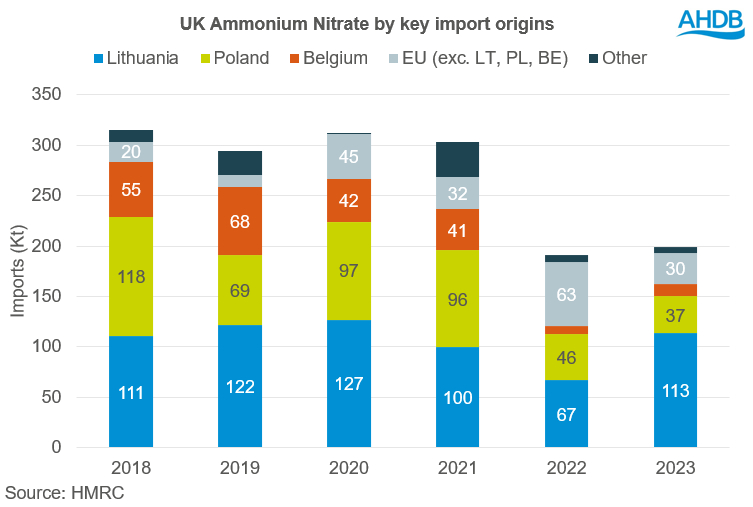
From 2018 to 2021, imports of ammonium nitrate (AN) were relatively stable, however declined considerably in 2022. This decline can be largely attributed to weakening demand in response to higher prices, as the British Survey of Fertiliser Practice 2022 report shows a 16% decline year-on-year for the overall application rate of nitrogen for all crops and grass. This demand destruction occurred following the temporary closure of one of two fertiliser sites in the UK in 2021 which spurred supply worries, and then the outbreak of war in Ukraine in 2022 exacerbated supply concerns driving elevated AN prices higher. At the natural gas price peak in August 2022, 70% of Europe’s ammonia production is estimated to have paused in response (IFASTAT). While total imports for 2023 rose 4% on the year to 199 Kt, imports are down 30% from the five-year average (HMRC).
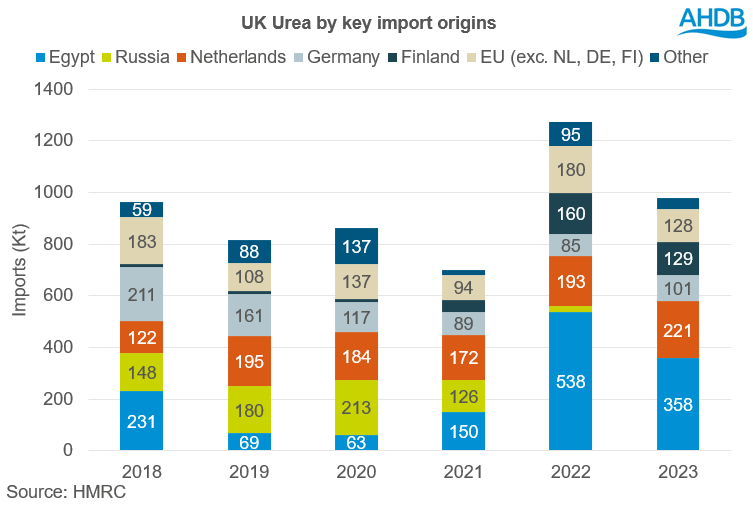
Although urea imports had overall been in decline 2018 to 2021, there was a significant increase of imports during 2022, primarily from Egypt. Following the tightening supply of AN due to the war in Ukraine, export values for urea increased incentivising urea production and supporting the export market. Global production of urea was expected to increase 2% in 2022 year on year (IFASTAT). While total UK imports fell in 2023, the quantity still exceeds previous import volumes between 2018 to 2021 (HMRC). It is important to note that while fertiliser is a key use of urea, it is not the only use, and therefore urea imports are not exclusively influenced by fertiliser demand.
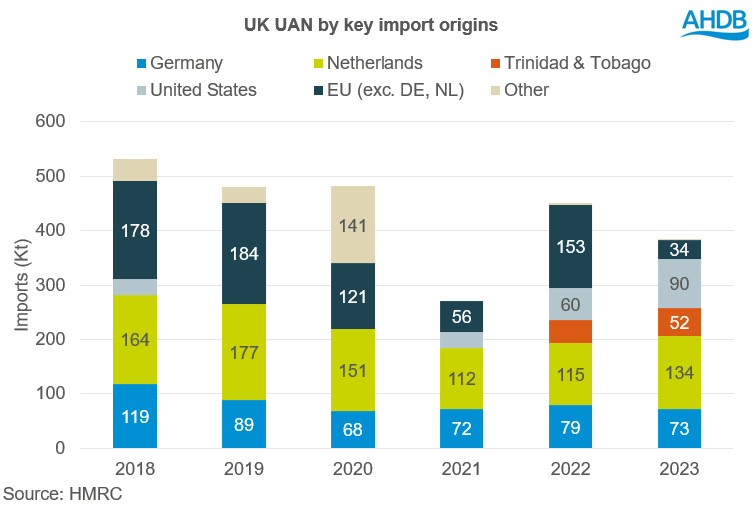
For UAN, imports appeared to be in a progressive decline, with a notable fall of imports during 2021. The EU energy crisis in 2021 is likely to have been a key catalyst for the fall of domestic imports. In previous years, imports of UAN had predominantly originated from the EU. Since 2021, imports from the United States increased considerably.

Europe key AN import origin
Overall, there is a strong dependence on Europe for AN, which for 2018 to 2022 accounted for almost 100% of supply, dropping to 99% for 2023. While the UK imports AN from numerous origins in Europe, Lithuania and Poland collectively account for the vast majority, totalling 75% of imports for 2023. Imports from Belgium decreased notably since 2022, consequently increasing reliance on imports from Lithuania and Poland.

Egypt becoming increasingly important urea origin
Over the past six years, import origins of urea have changed considerably. Russia had been a significant origin until 2022 when, following the war in Ukraine, imports reduced substantially and then entirely in 2023. In turn, imports from Egypt increased 260% from 2021 to 2022, with 97% of imports for 2022 occurring March to December. Following the elevated urea prices, from strong demand and tight global fertiliser supply, this incentivised greater urea production in Egypt and supported exports.

UAN key origins include EU, US and Trinidad and Tobago
Alike to urea, imports of UAN have a wider range of origins than AN. While imports from Europe remained fairly stable over the six-year period, there has been recent increases of imports from the United States and Trinidad and Tobago. Reduced production of UAN in the EU, following the outbreak of war in Ukraine, supported increased imports from US and Trinidad and Tobago.

What does this mean for the UK?
As the UK’s supply of AN remains to be focused in Europe, with greater reliance on Lithuania, the European gas market continues to be key factor for the stability of AN prices domestically. Although the recent imports of UAN from US and Trinidad and Tobago increase and diversify the supply of UAN, total imports have continued to decline. In contrast to AN and UAN, imports of urea have increased since 2022 as the supply of AN and UAN became tight and thus alternate sources of fertiliser were in high demand. With Egypt boosting their urea production in the coming months, this could help to supply UK demand, something to watch going forward.
Overall, despite some steadying of AN fertiliser prices in recent months, going forward EU gas supplies and gas price movements will be important for nitrogen fertiliser price direction. For 2023, the US and Norway accounted for 49% of natural gas supplies to the EU, while Russia accounted for only 15% from 45% in 2021. As Europe’s natural gas supply diversifies and dependence on Russia reduces, this will help to alleviate some volatility for Europe’s natural gas market. Though EU gas supplies will remain a key watchpoint for nitrogen fertiliser price direction as we head through summer towards winter 2024. Given the UK’s reliance on imports, the varying exchange rate and global supply and demand of fertilisers will continue to be a key focus too.
For businesses, monitoring this key on-farm cost will be important, consider using tools like Farmbench to compare your farm performance amongst similar farms. Furthermore, as discussed in the nitrogen fertilisers outlook, assessing what source of nitrogen is optimal is also a key consideration as reviewing nitrogen use efficiency and potentially seeking alternate sources could help to manage fertiliser cost.
Sign up to receive the latest information from AHDB.
While AHDB seeks to ensure that the information contained on this webpage is accurate at the time of publication, no warranty is given in respect of the information and data provided. You are responsible for how you use the information. To the maximum extent permitted by law, AHDB accepts no liability for loss, damage or injury howsoever caused or suffered (including that caused by negligence) directly or indirectly in relation to the information or data provided in this publication.
All intellectual property rights in the information and data on this webpage belong to or are licensed by AHDB. You are authorised to use such information for your internal business purposes only and you must not provide this information to any other third parties, including further publication of the information, or for commercial gain in any way whatsoever without the prior written permission of AHDB for each third party disclosure, publication or commercial arrangement. For more information, please see our Terms of Use and Privacy Notice or contact the Director of Corporate Affairs at info@ahdb.org.uk © Agriculture and Horticulture Development Board. All rights reserved.


