Wealthier wheat - Targeting top 25% conventional winter feed wheat performance
Friday, 25 September 2020
Attention to detail is king, yield is the prince
Changes to the subsidy system, volatility in prices and the impact of the weather are just a few of the current and future challenges for wheat growers. To stay ahead of the game, achieving a top 25% performance will enable you as a grower to limit the damage or better still, produce a profitable crop during challenging times.
AHDB has examined the farm business performance data in Farmbench from the last two harvest years for feed wheat and found that:
- Broadly speaking, of the difference in net margin between the top 25% and the rest, 50% is due to higher income and 50% is due to lower total costs
- Wheat yield was the biggest influence on crop income
- Higher wheat prices didn’t guarantee better net margins if costs were high
- Machinery and equipment costs have a bigger influence on net margin than yield or price alone.
This is not to say that other costs are not important, but rather that their effect on the bottom line is smaller. However, making smaller adjustments across the whole cost structure could add up to a similar result and other factors from the whole farm business need to be considered.
Top 25% targets at a glance
The following shows what the top 25% were achieving on average and the range for harvest 2018 and 2019, focussing on conventional winter feed wheat.
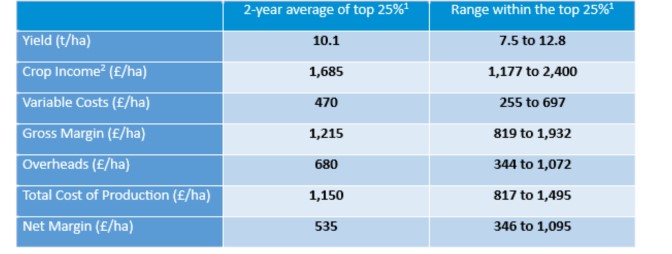
1Top 25% of conventional winter feed wheat ranked by net margin performance
2Grain and straw income
The analysis
In the last two years, the top 25% group had a net margin* that was 170% higher than the middle 50% performing crops and over three times higher than the bottom 25%.
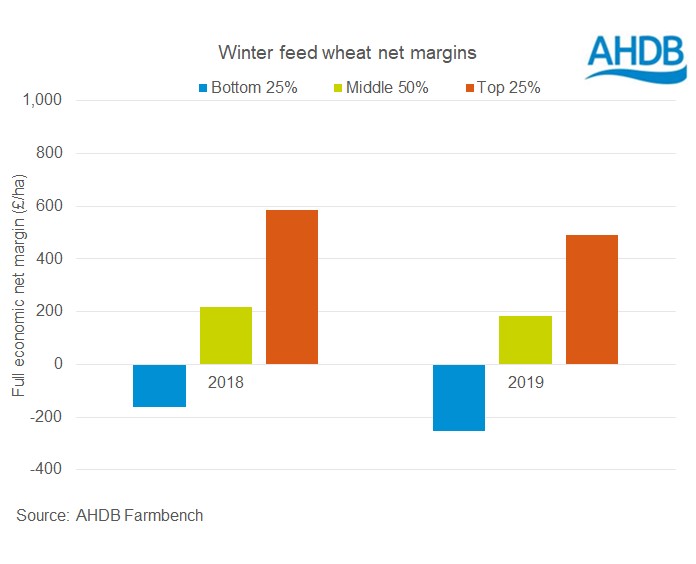
*Net margin is crop income less all costs including depreciation and a value for unpaid labour, rent and finance but excluding subsidies.
So, is yield king and costs secondary or is price a more significant factor in reaching top 25% margin performance?
Is yield the key difference
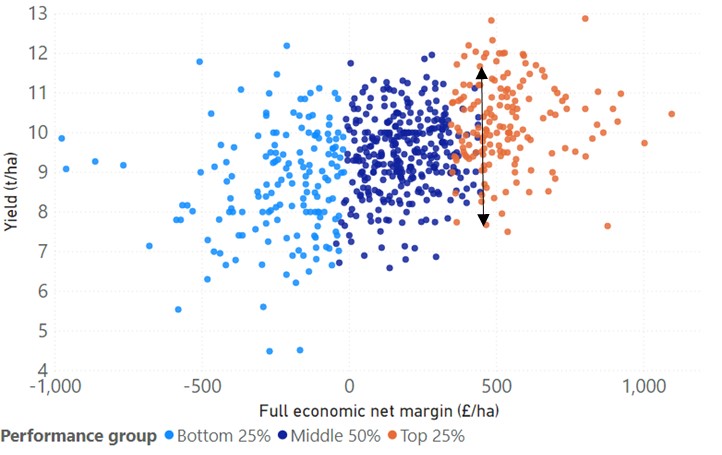
On average the top 25% achieved higher yields but with a wide range from 7.5 to 12.8t/ha.

Many of the bottom 25% and middle 50% of crops produced similar yields to the top performers. Likewise for the same margin. For example, at around £460 per hectare net margin, one crop achieved it with 7.7t/ha and another with 11.8t/ha in the same year (see chart below). So rather than yield being king, it is more like yield is prince.
Don’t rely on just getting a better price
The top 25% received £7-10/t more for the wheat than the bottom 25% and £5/t more than the middle group. So it could be assumed that higher prices guarantee better net margins.

Not necessarily. For example, there were individual results in the top, middle and bottom groups, all with a wheat price of around £140/t. However, all those in the bottom group made a loss at that price and all those in the top group had a positive margin.
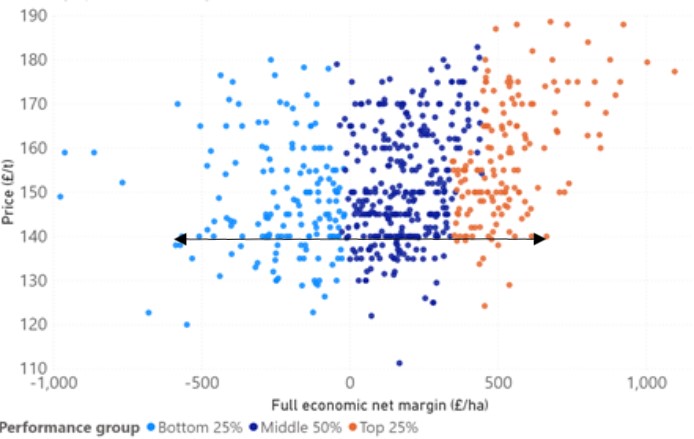
The adage that averages can hide more than they reveal certainly is true in this case. Price alone will not achieve a positive net margin if costs are high. A combination of price and yield as well as any income from straw is a strong contributor to being top 25%.
Low costs pay
The top 25% had a total cost of production at around £1150 per hectare in the last two years. About £400 per hectare less than the bottom group. Total overheads accounted for over £330 of the difference.
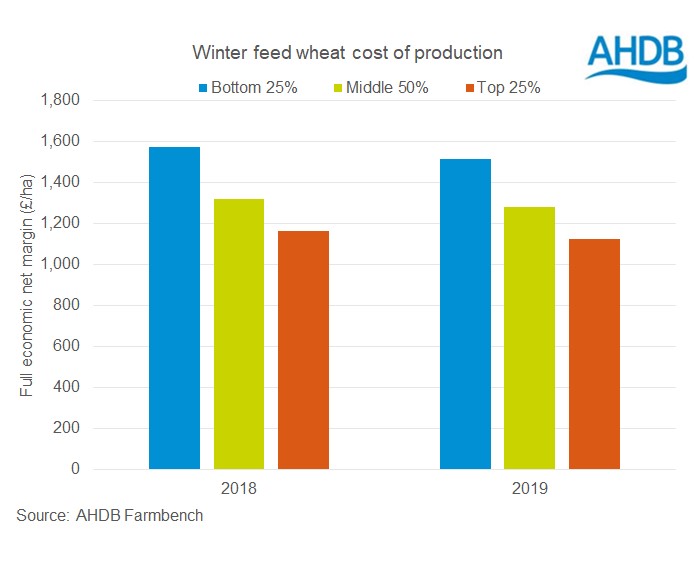
It’s no surprise that labour and machinery costs are the major proportion of these costs. But, this analysis has shown that labour and machinery costs are a stronger driver of net margin than yield or price alone.
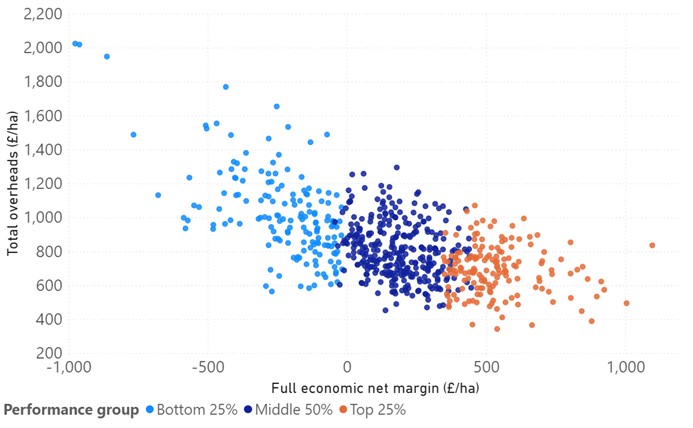

#Includes paid and unpaid labour, fuel, depreciation, hire, contracting, spares and repairs
What does this all mean?
Optimising yields to the level of inputs and keeping a tight control on machinery and equipment costs will go some way to achieving top 25% performance. Paying attention to detail in these areas plus others such as your marketing strategy, growing for a market, production system, crop rotation etc will take you all the way to the best performance.
About the figures
- Figures derived from AHDB Farmbench data: ahdb.org.uk/Farmbench
- Farmbench results from 2018 and 2019 harvest years
- Figures used are conventional winter feed (Group 4) wheat excluding any seed or hybrid variety crops
- Based on over 630 separate crop enterprise results
- Benchmarks are ranked on full economic net margin
- The performance groups were kept separate for each year rather than representing an average over the two years
- Full economic means they include all non-cash costs to the business. These are the costs you can’t see going out of your bank account – machinery and buildings depreciation, unpaid labour and the rental value of owned land.
Sign up for regular updates
You can subscribe to receive Grain Market Daily straight to your inbox. Simply fill in your contact details on our online form and select the information you wish to receive.
Topics:
Sectors:
Tags:

