Suckler cattle: An unexpected insight from Farmbench top performers
Friday, 26 April 2024
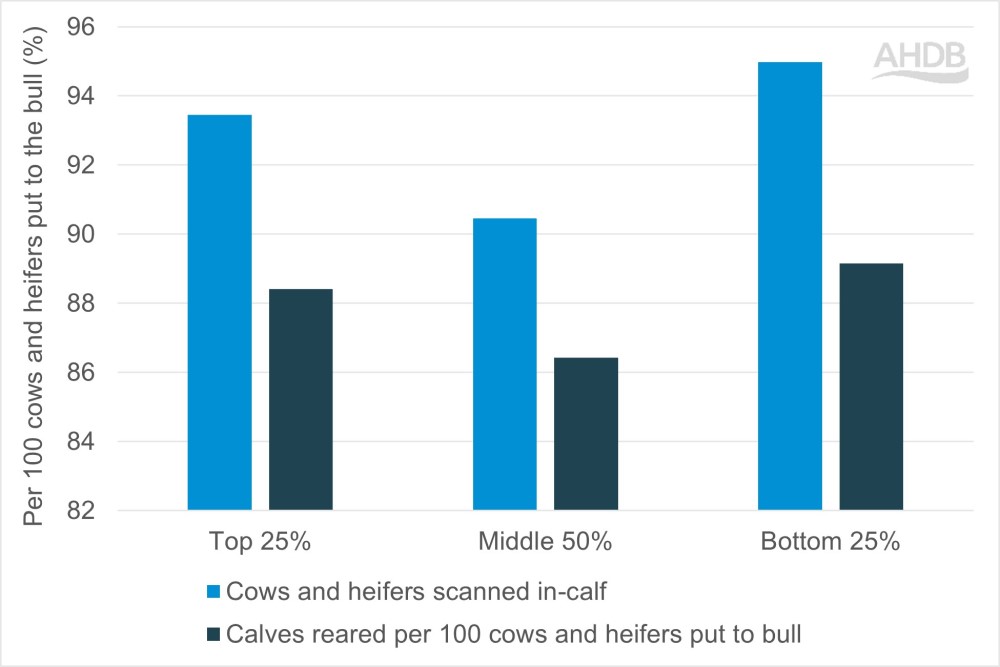
Farmbench data shows that the bottom 25% of suckler herds produce the most calves per 100 cows and heifers put to the bull. So, how do the top 25% achieve a better net margin with fewer calves?
Top-performing farms do not produce the most calves
An analysis of 60 farms with suckler herds from 2021/22 Farmbench data showed an unexpected result. When compared to the top 25% and middle 50%, farms which ranked in the bottom 25% for net margin had:
- A higher average rate of cows and heifers scanned in-calf
- A higher number of calves reared per 100 cows and heifers put to the bull
Improving these key performance indicators (KPIs) is important for achieving better returns; data showed that the top 25% of farms did outperform the middle 50% on both these measures.
What are the top 25% doing differently to achieve a higher net margin per cow and heifer put to the bull compared to the rest?
Figure 1. The bottom 25% of suckler herds (ranked by net margin) produced the highest number of calves per 100 cows and heifers put to the bull

Source: AHDB Farmbench data 2021/22
Cost of production is a key performance driver
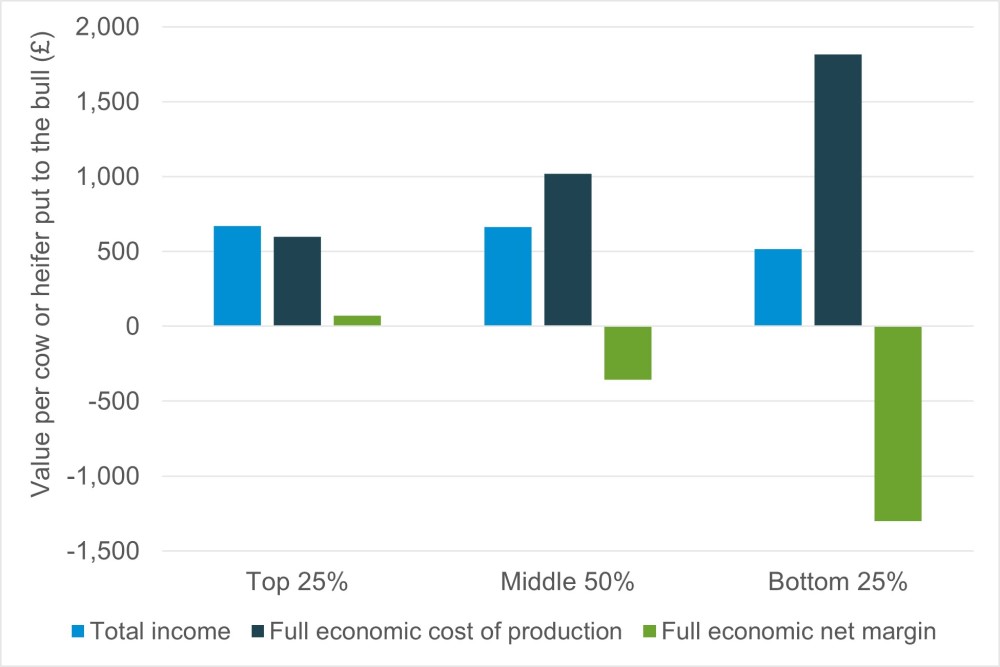
Comparing the top-, middle- and bottom-performing farms showed only a small difference in income per cow put to the bull. On average, the bottom-performing farms returned £100 less than the rest.
The largest difference between the groups was the cost of production. The total cost among the top 25% was one-third of the value incurred by the bottom 25%. This indicates that strong cost control allowed top-performing farms to achieve a positive net margin.
Figure 2. The best-performing suckler herds had the lowest cost of production

Source: AHDB Farmbench data 2021/22
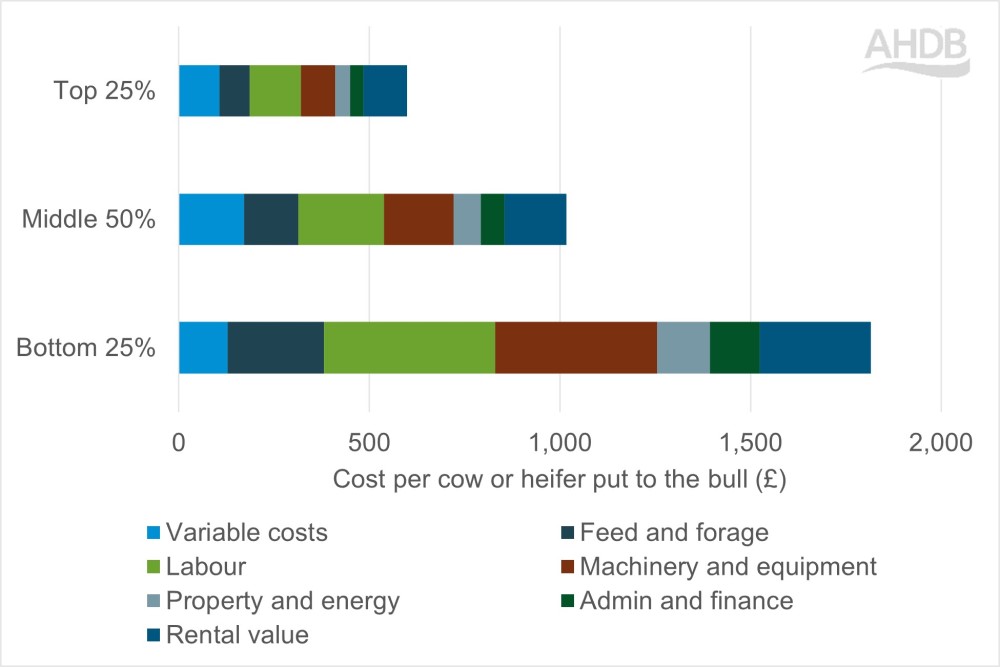
Breaking down the cost of production into categories showed that variable costs, such as veterinary bills, contributed a relatively small amount. However, there were larger differences between the overhead costs.
The key differences between the top-, middle- and bottom-performing farms were the cost of:
- Feed and forage
- Labour
- Machinery and equipment depreciation
The top-performing farms had significantly lower overhead costs in general.
Figure 3. The bottom 25% of farms had the highest overhead costs

Source: AHDB Farmbench data 2021/22
What can I do to improve my suckler herd’s profitability?
Our Farmbench team offer free, confidential 1:1 sessions to help calculate your enterprise margins and allow you to compare your own business to the national figures. This can help you to:
- Know your cost of production and identify which costs have the greatest impact on your margins
- Target high productivity from your cows and heifers and achieve a good weaned calf sales value
- Find ways to combat your most significant costs by, for example:
- Reducing your expenditure or spreading it over multiple enterprises
- Machinery sharing
- Spreading labour over other enterprises
- Running the optimal number of cattle for your farm
Contact your regional Farmbench Manager to find out more.
Useful links
Farmbench − a farm business tool

