Metrics for mobility in dairy cows
Thursday, 20 May 2021
Much in the same way we use milk recording and mastitis treatments to drive udder health improvement, we can use regular (monthly) mobility scores and foot trimming data to do the same for lameness.
There are a huge number of parameters we can calculate with a working knowledge of spreadsheets (especially pivot tables). Here is a flavour of just a few of vet Nick Bell’s favourites.
1. Mobility index
A plot of mobility scores can be a highly visual means of showing trends, risks and efficacy of foot health measures. The mobility index is the percentage of cows which are score 0 and 1 (non-lame). It is important to have the same person scoring each time, in a consistent way. Sensitivity should be at a level to pick up bruising before it progresses to more severe lesions like sole ulcers.

2. Lameness duration
By taking average lameness prevalence for the year and the number of treatments it is possible to estimate lameness duration. This is very much an approximation, but it can be surprisingly thought provoking. It is worth managing expectations: in one study it was found the time between detection on fortnightly scoring (already a 1-14 day delay) and median treatment was 65 days (Leach and others 2012) and 6 week cures rates can be below 50% when there are delays to treatment (Thomas and others 2016).

For a herd to achieve a 35 day average lameness duration (1 week prior to getting the cow in the crush and 4 weeks to recover), in a herd with a 30% lameness prevalence would need to conduct approximately 313 treatments, while a 5% prevalence herd would only need 52 treatments. Of course, the real number is likely to be different as the dynamic is driven by chronic cows which might not have curable conditions.
3. Mobility score filtered for a specific parity
In this case, mobility score for parity 1 was broken down by treatment and by days in milk. Herd mobility scores can be improved by culling, and failure to cull older cows for whatever reason can generate a worsening herd trend. Lameness risk is greatest around calving, especially for first calvers so accounting for heifer demographics and seasonal calving is important. Interventions applied over the top of this can be interesting to explore. In this case trimming pre-calving (G3, G4) and 100 days in milk (G1, G3) increased lameness risk.

4. Lesion seasonality
Ideally looking at 2-4 years’ worth of data will help identify seasonal patterns. Here is a stacked bar chart showing monthly recorded lesion events. Note the spike in claw lesions after the prolonged heat in July, August and early September.

5. Lesion prevalence
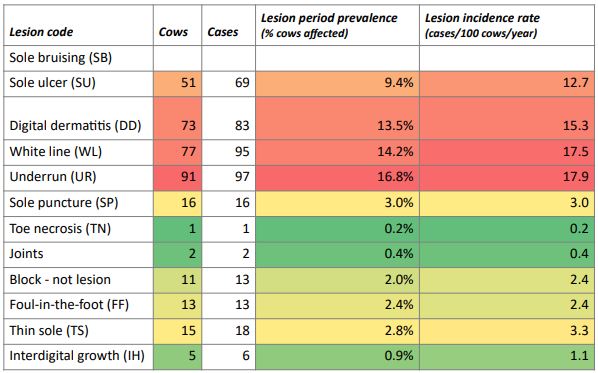
For many disease events incidence rate is the most appropriate epidemiological measure. It is possible to calculate a lameness or lesion incidence rate using software that calculates cow-days in the herd. Lameness incidence a good measure of effort and lesion incidence a good diagnostic parameter. However, for conditions that involve chronic pathological change and high rates of recurrence, a percentage of affected cows in a period (a period prevalence) is more useful. For example, for many herds the cow with toe necrosis is never treated properly, she is presented to the trimmer each month, who for legal reasons can’t administer local anaesthetic and therefore the lesion is never fully debrided. All the trimmer can do is make the cow comfortable with a block. This cow could have 5+ recorded lameness events in 6 months and never fully recover, while the cow with digital dermatitis might have one event which improves within 10 days. The toe necrosis incidence distorts the recorded events by registering more treatments, which is the correct parameter if recording treatment effort, but the wrong parameter if investigating reasons generating new lameness cases.

Normally period prevalence will be around 5% for each of sole ulcer, white line and digital dermatitis. Sole bruising is an important positive finding if Early Detection and Prompt Effective Treatment (EDPET) is happening as required.
Other parameters
There are a number of other calculations we can make including actual verses target trim events, lesions by days in milk, cases by months since birth, time between detection and treatment and so on. With good quality lameness event data recorded alongside monthly mobility scores and good routine trimming regimes, recorded separately, then many insights can be gained from some simple analysis. If you are interested in learning more then please join the BCVA workshop on Data Driven Decisions, an Intermediate Course on lameness to be run on 25th August 2021.
In the next article we look at one specific type of data: the M-score.
References
LEACH, K.A.A., TISDALL, D.A.A., BELL, N.J.J., MAIN, D.C.J.C.J. and GREEN, L.E.E. (2012) The effects of early treatment for hindlimb lameness in dairy cows on four commercial UK farms. 193, 626–632.
THOMAS, H.J.J., REMNANT, J.G.G., BOLLARD, N.J.J., BURROWS, A., WHAY, H.R.R., BELL, N.J.J., MASON, C. and HUXLEY, J.N.N. (2016) Recovery of chronically lame dairy cows following treatment for claw horn lesions: A randomised controlled trial. Veterinary Record 178, 116.
Sectors:

