Final cereal quality results confirm lower protein levels: Grain market daily
Tuesday, 1 November 2022
Market commentary
- UK feed wheat futures (Nov-22) closed at £274.70/t yesterday, gaining £10.20/t from Friday’s close. The May-23 contract gained £9.45/t over the same period, closing at £289.45/t.
- May-23 Paris rapeseed futures closed at €659.75/t yesterday, gaining €22.75/t from Friday’s close.
- The support in both cereals and oilseeds markets resulted from Russia pulling out of the Black Sea export agreement, reigniting concerns over global supplies (Refinitiv).
- ICE UK nearby natural gas futures gained 22% from Friday’s close, settling at 300.74p/therm yesterday. Again, this was largely driven by the developments with the Ukraine grain corridor over the weekend.
Final cereal quality results confirm lower protein levels
The final set of results for the 2022 AHDB Cereal Quality Survey (CQS) are now available.
From November 2022, the methodology for validating samples has been updated. Please take this into consideration when comparing to historical figures. Comparisons in this commentary are to give context to this year’s results.
Wheat
Final results from the 2022 AHDB Cereal Quality Survey (CQS), including data up to 24 October, continue to show below average protein content in milling wheat samples, while specific weights and Hagberg Falling Numbers came in higher than usual.
The average protein content of UK flour millers group 1 varieties came in 0.4% percentage points (pp) below the milling specification of greater than or equal to 13%, at 12.6%. This is down from the 2021 average of 13.2% and lower than the three-year average of 13%. It is likely that lower protein levels were caused by the hot and dry conditions at the time of the final nitrogen application, limiting uptake.
The average specific weight of group 1 varieties came in at 81.6kg/hl, which is above the milling specification of greater than or equal to 76.0kg/hl. This is higher than 2021 and the three-year average.
Average Hagberg Falling Numbers of group 1 wheat varieties were at 347 seconds (s). This is 61s above last year and 39s higher than the three-year average.
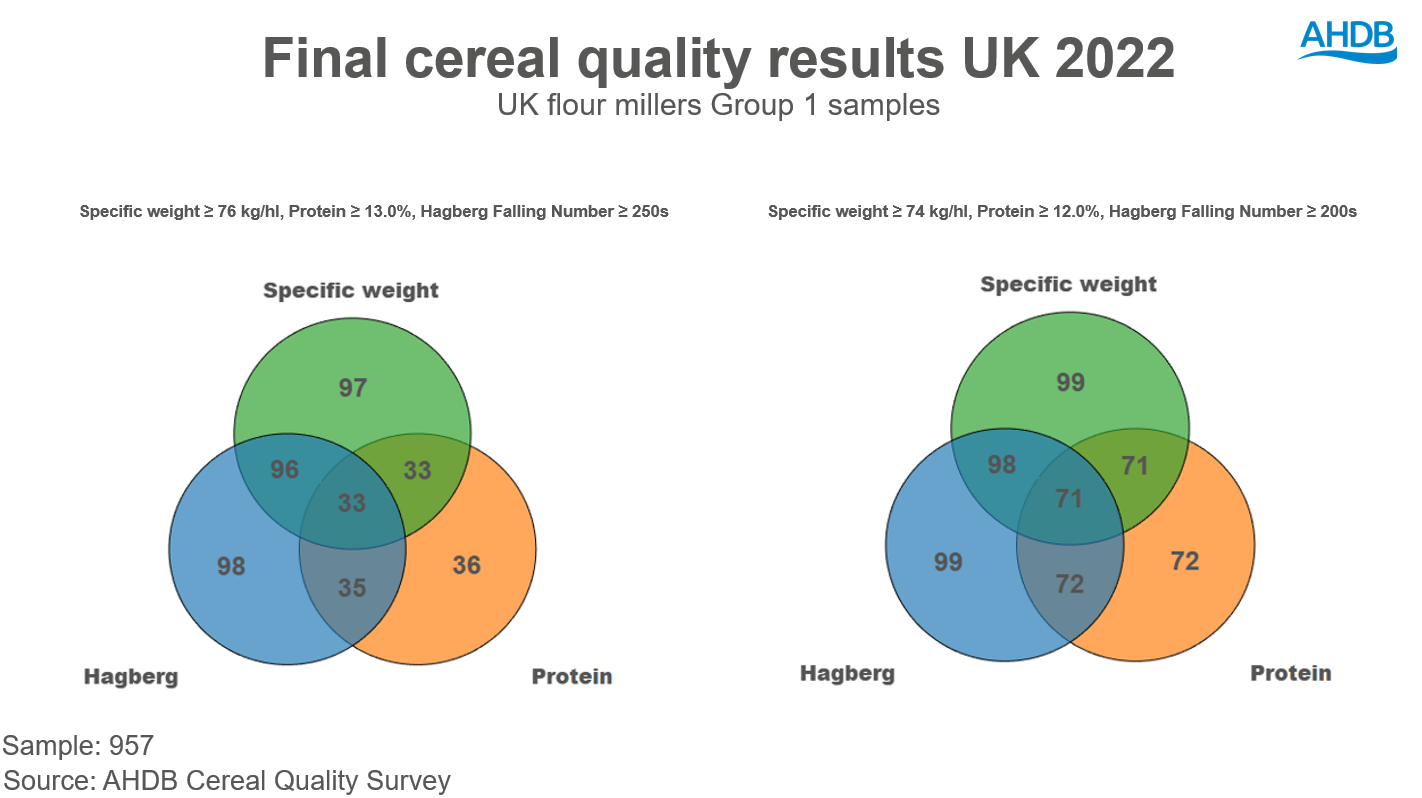
The final 2022 results show that 33% of group 1 milling wheat samples met a typical group 1 specification (specific weight ≥ 76kg/hl, protein ≥ 13.0%, HFN ≥ 250s). This is compared with 20% in 2021. 71% of group 1 samples are meeting the following additional specification requirements: specific weight ≥ 74kg/hl, protein ≥ 12.0% and HFN ≥ 200. This is down 2pp from the provisional estimates but up on the year.
Barley
The final results show that average nitrogen content of GB barley samples is 1.52%.
For winter barley, nitrogen content averaged 1.70%, up from 1.57% last year and higher than the three-year average of 1.66%. The nitrogen content in spring barley samples averaged 1.50%, which is marginally higher than in 2021 (1.48%), but lower than the three-year average of 1.58%.
While average GB specific weights are lower than provisional estimates at 66.5kg/hl, they remain higher than last year. Winter (68.1kg/hl) and spring barley specific weights (66.4kg/hl) are up year-on-year by 3.3kg/hl and 3.4kg/hl respectively.
The proportion of barley retained by a 2.5mm sieve was 86.7% for winter barley and 94.6% for spring barley. For winter barley this is just 1.1pp lower than in 2021 but 4.8pp lower than the 3-year average. Whilst for spring barley this is 0.8pp lower than in 2021 but only 0.3pp lower than the 3-year average. When looking at this year’s results, it is worth noting that some samples may include admixture.
Note
The 2022 wheat and barley sample sizes were smaller than in 2021 at 1,955 and 8,784 respectively. Therefore, these results solely offer some insight into the 2022 crop quality.
From November 2022, the methodology for validating samples has been updated. Please take this into consideration when comparing to historical figures.
Due to a low response rate, Eastern and Midlands along with South East and South West have been combined for wheat and the South East and South West have been combined for barley.
Some samples may not contain results for all quality parameters, with some screening values % through 2.25mm may include admixture.
Sign up for regular updates
You can subscribe to receive Grain Market Daily straight to your inbox. Simply fill in your contact details on our online form and select the information you wish to receive.
While AHDB seeks to ensure that the information contained on this webpage is accurate at the time of publication, no warranty is given in respect of the information and data provided. You are responsible for how you use the information. To the maximum extent permitted by law, AHDB accepts no liability for loss, damage or injury howsoever caused or suffered (including that caused by negligence) directly or indirectly in relation to the information or data provided in this publication.
All intellectual property rights in the information and data on this webpage belong to or are licensed by AHDB. You are authorised to use such information for your internal business purposes only and you must not provide this information to any other third parties, including further publication of the information, or for commercial gain in any way whatsoever without the prior written permission of AHDB for each third party disclosure, publication or commercial arrangement. For more information, please see our Terms of Use and Privacy Notice or contact the Director of Corporate Affairs at info@ahdb.org.uk © Agriculture and Horticulture Development Board. All rights reserved.


