EU pork prices and production so far this year
Wednesday, 7 June 2023
Pig producers in the European Union (EU) continue to face multiple challenges impacting on the market. High input costs continue to prevail, impacting on production, while the threat of African swine fever (ASF) continues to persist over the region, limiting export opportunities. We take a look into production and prices so far this year.
Production
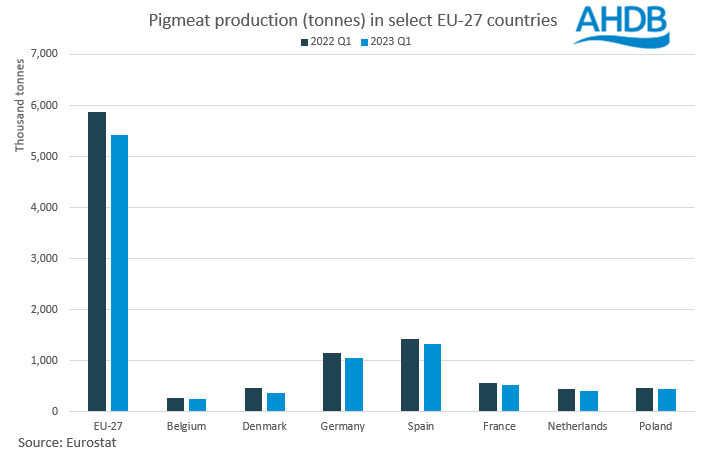
In the first quarter of 2023 (Jan – Mar) an estimated 5.4m tonnes of pig meat was produced in the EU-27. This is a reduction of just under half a million tonnes (-8%) from the same period in 2022. EU short-term outlooks forecast production to decline 5% across the whole year.
Although Spain remains the largest producer of pig meat in Europe, the country has seen the largest volume decline year on year, with Q1 2023 levels sitting just below 1.33m tonnes. This is a fall of 97.6k tonnes (-7%) from Q1 2022. Similarly large falls in production have been recorded in Germany and Denmark, where year to date figures are down 94.8k tonnes (-8%) and 91.6k tonnes (-20%) respectively from 2022 levels.
Other key producing countries such as the Netherlands, France, and Belgium have seen production fall between 27–47k tonnes (5-10%) compared to last year. Poland recorded the smallest year on year decline of the key producers, with production down 12.1k tonnes (-3%) in the first three months of the year.
Reduced slaughterings have driven the fall in production volumes. Total slaughter is estimated to have reached just under 57.1m head for Q1 2023. This represents a fall of over 4.7m head from the same period in 2022.
As with production, Spain saw the largest year on year reduction, with slaughter numbers down 1.4m head (-9%), which bought Q1 slaughter to 14.1m head. Germany has also seen a significantly large drop, down nearly 1.0m head (-8%) from 2022, to 11.1m head. Denmark’s slaughterings fell 810k head to nearly 4.2m head for Q1 2023. Again, Poland saw the smallest decline year on year, down 150k head; meanwhile other key producing countries such as the Netherlands, Belgium and France have seen slaughter numbers decline between 300–430k head.
Prices
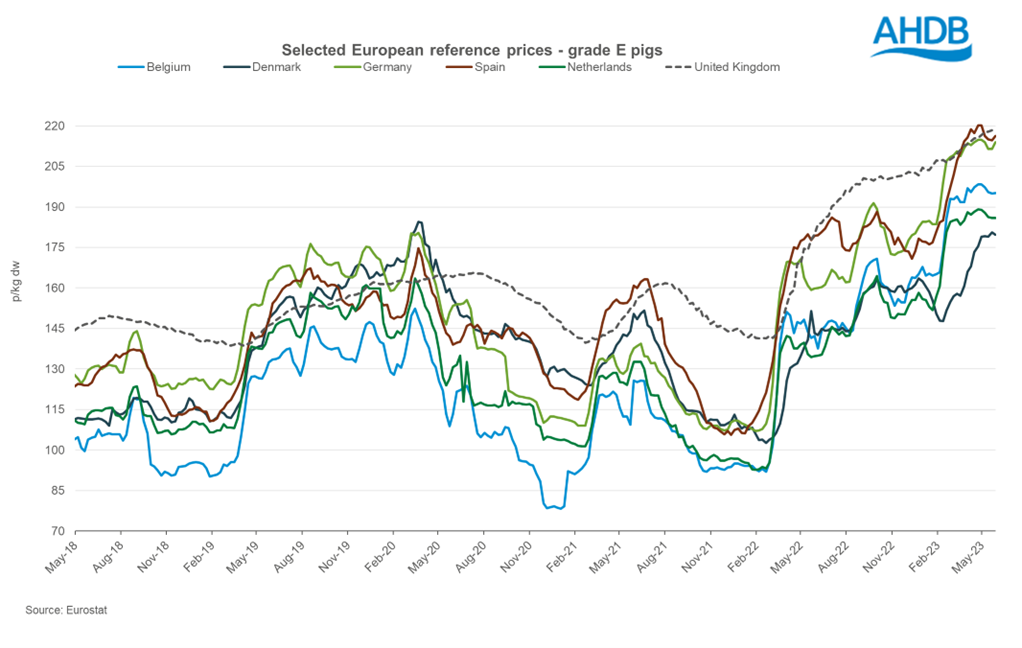
As production has fallen, and supplies have become tighter, EU reference prices have seen extended growth since the end of January.
Following a four-week period of decline EU deadweight prices have re-gained momentum, hitting an average of 208.39p/kg for the week ending 28 May. This is an increase of 28.54p from the beginning of the year. The average EU reference price reached a peak of 212.14p for the week ending 30 April.
Reference prices in key producing countries have, for the most part, all seen similar climbs from the beginning of the year. Spain has seen a gain of nearly 40p/kg, as Belgium, Germany, the Netherlands and Poland saw gains of around 30p/kg. Price rises in Denmark have been dampened compared to other countries, only gaining 19p/kg with upwards movements starting a month behind most other nations.
In the last month, movements in reference prices have been more subdued, possibly due to vola,tility in the export market, especially regarding China. For the three weeks ending 21 May prices eased between 2-5p/kg in Belgium, Germany, Spain, the Netherlands and Poland. In the final week of May (w/e 28 May) prices regained ground in Germany, Spain and Poland by roughly 2p.

Sign up for regular updates
Subscribe to receive pork market news straight to your inbox. Simply complete our online form.
While AHDB seeks to ensure that the information contained on this webpage is accurate at the time of publication, no warranty is given in respect of the information and data provided. You are responsible for how you use the information. To the maximum extent permitted by law, AHDB accepts no liability for loss, damage or injury howsoever caused or suffered (including that caused by negligence) directly or indirectly in relation to the information or data provided in this publication.
All intellectual property rights in the information and data on this webpage belong to or are licensed by AHDB. You are authorised to use such information for your internal business purposes only and you must not provide this information to any other third parties, including further publication of the information, or for commercial gain in any way whatsoever without the prior written permission of AHDB for each third party disclosure, publication or commercial arrangement. For more information, please see our Terms of Use and Privacy Notice or contact the Director of Corporate Affairs at info@ahdb.org.uk © Agriculture and Horticulture Development Board. All rights reserved.


