Rapeseed. The main player of the oilseed complex? Analyst Insight
Thursday, 26 August 2021
Market commentary
- UK wheat futures (Nov-21) closed yesterday at £193.35/t, down £0.65/t from Tuesday’s close. The May-22 contract closed at £198.90/t, down £0.80/t.
- UK futures followed the Chicago (Dec-21) and Paris (Dec-21) wheat futures, as they both felt some pressure. Profits are still being booked after a strong rally, but the fear of tightening supplies curb losses.
- Chicago wheat futures (Dec-21) closed yesterday at $266.55/t, down $18.18/t since the recent peak in prices on 16 August.
-
According to data released today, 501.9Kt of home-grown wheat and 241.3Kt of home-grown barley was in merchants, ports and co-ops stocks at the end of June, down 43% and 42% year-on-year, respectively. 403.3Kt of wheat was also estimated to be on-farm at the end of June in England and Wales.
Rapeseed. The main player of the oilseed complex?
Global oilseed values have gained a lot of support since the start of the pandemic. This has led to high domestic rapeseed prices.
Delivered rapeseed (into Erith, Nov-21) was quoted last Friday at £498.50/t, up £150.50/t year-on-year.
With the whole oilseed complex currently supported, where could we see rapeseed prices going this marketing year?
As oilseeds are relatively homogenous and interchangeable, rapeseed prices will not significantly price away from the greater oilseed complex. Thus, future supplies of other oilseeds should not be disregarded.
Within this analysis I am going to discuss:
- How soyabean markets can influence rapeseed markets – demonstrating the price correlation.
- The European edible oil market – looking at previous price trends and relationships between these oils within the market.
- Finally, what will drive rapeseed prices –discussing potential market information that could change the sentiment for oilseeds going forward.
Rapeseeds relationship with soyabeans
Although conventionally rapeseed values exceed soyabeans, their pricing relationship remains relatively tight.
Often, soyabeans largely drive global sentiment of the oilseed complex. It accounts for a large proportion of oilseed production that is processed into edible oils. The latest USDA report estimates global soyabean production at 383.6Mt for the 2021/22 marketing year.
This is well over double the estimated 146.8Mt of rapeseed, sunflower and palm (kernel) production (combined).

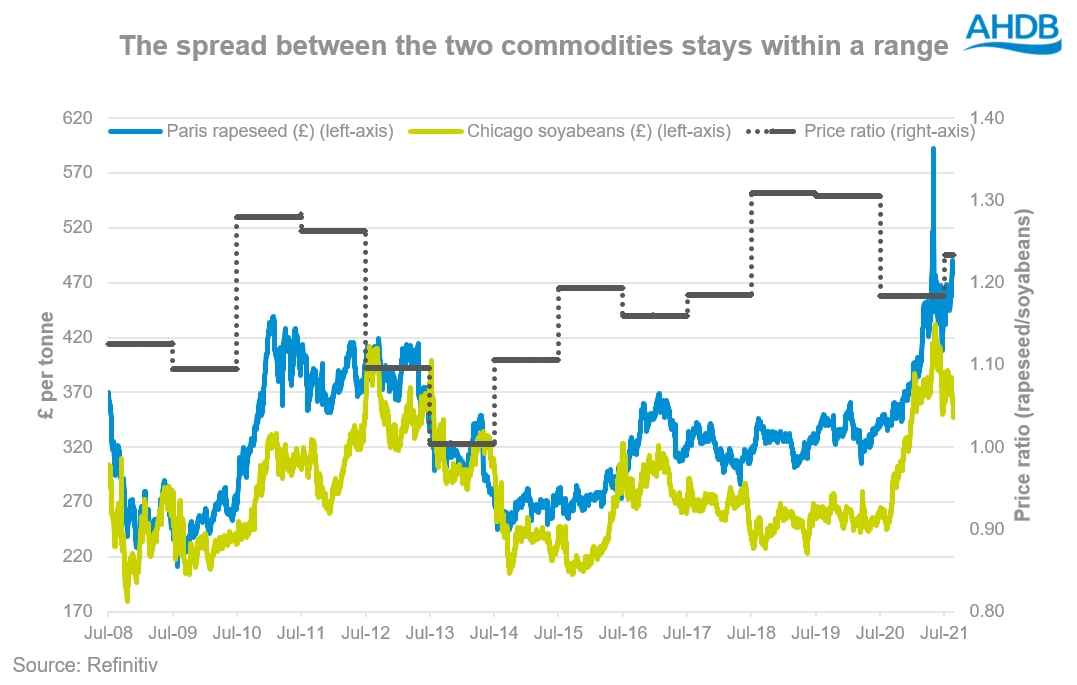
This graph is showing relationship between soyabean and rapeseed prices. The right-axis shows the average (across the marketing year) price ratio between the two commodities, going back to July 2008.
This graph shows that the price of these two commodities are relatively aligned and fluctuate together.
The price ratio does differ each year but on average always remained between 1.0 and 1.3. This means on average, the rapeseed value only exceeded the soyabean value by 30%.
Edible oil trade in Europe
Naturally, with high oilseed prices comes support to edible oil prices. We know that the EU has a rapeseed deficit for 2021/22, but are we expecting rape oil prices to run away from the other oils?
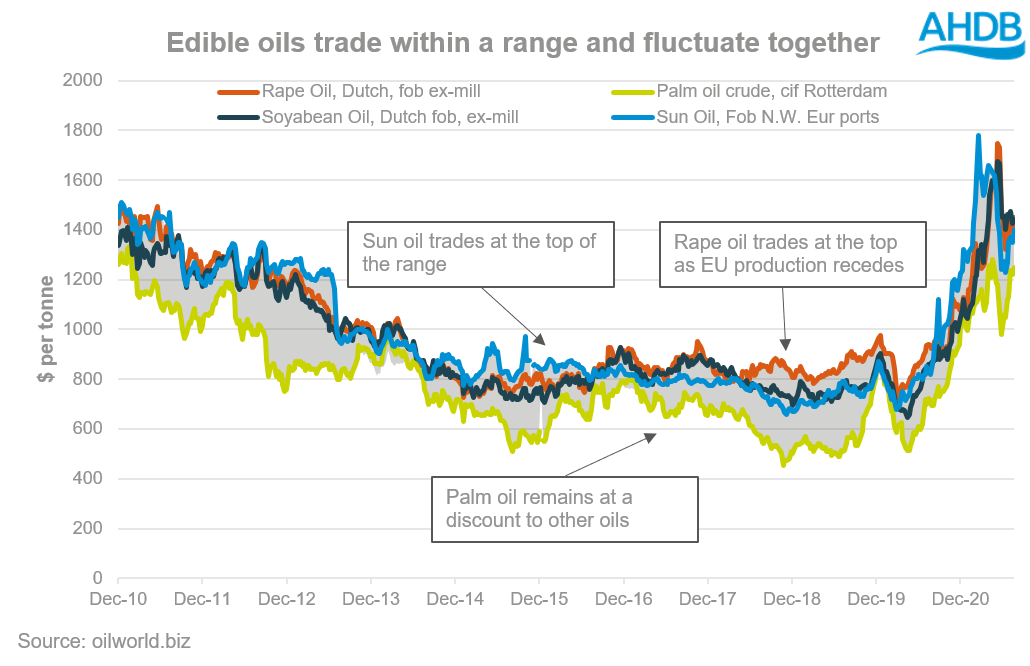
In the last 11 years the main 4 oils that the EU consumes have traded within an average range of $233/t. Supply and demand pictures tend to dictate which oil is priced top, although usually palm oil is discounted to the others. Where the remaining oils trade depends on the market outlook for that year.
In the 2015/16 marketing year sun oil traded at the top of the range in Europe. This was due to EU sun oil stocks-to-use ratio tightening from 7% to 4% year-on-year.
From 2016 rape oil has largely been at the higher end as EU rapeseed production has been on a successive decline. This has added to the general tightening global stocks-to-use ratio of rape oil.
This shows these key oils trade within a range of one another, but supply and demand pictures will influence where they trade within that range.
What will drive my rapeseed price?
What is critical to note is that other oilseed will largely dictate the market sentiment for rapeseed. Linking back to the start, soyabeans will be a sentiment changer in global prices.
Global stocks of soyabeans are expected to increase 3.3Mt year-on-year to 96.1Mt for 2021/22. Anticipated production increases for Argentina (+6.0Mt), Brazil (+7.0Mt) and the US (+5.5Mt) has largely driven this.
This said, Argentina and Brazil’s production estimates are only preliminary as the crop is yet to be planted.
The latest US crop conditions report rates 56% of soyabeans good-to-excellent, down from the 69% last year-on- year. This said, there are no drastic revisions to production estimates yet as pod set is around average.
With all this in mind, sentiment could change in the coming months having a knock-on effect to rapeseed. And this is all before we even talk about the demand side of soyabeans.
Conclusion
Within this analysis I have shown that:
- Soyabeans and rapeseed are closely aligned within the global market.
- Furthermore, rape oil is unlikely to price itself out of the market linking back to the close alignment with other oils.
- Finally, there is still a lot to play out in the global oilseed market for the 2021/22 marketing year.
Rapeseed prices may be very attractive now, but careful consideration of the wider complex must be accounted for if planting rapeseed for 2022 harvest.
Sign up for regular updates
You can subscribe to receive Grain Market Daily straight to your inbox. Simply fill in your contact details on our online form and select the information you wish to receive.
While AHDB seeks to ensure that the information contained on this webpage is accurate at the time of publication, no warranty is given in respect of the information and data provided. You are responsible for how you use the information. To the maximum extent permitted by law, AHDB accepts no liability for loss, damage or injury howsoever caused or suffered (including that caused by negligence) directly or indirectly in relation to the information or data provided in this publication.
All intellectual property rights in the information and data on this webpage belong to or are licensed by AHDB. You are authorised to use such information for your internal business purposes only and you must not provide this information to any other third parties, including further publication of the information, or for commercial gain in any way whatsoever without the prior written permission of AHDB for each third party disclosure, publication or commercial arrangement. For more information, please see our Terms of Use and Privacy Notice or contact the Director of Corporate Affairs at info@ahdb.org.uk © Agriculture and Horticulture Development Board. All rights reserved.


