How is ag inflation affecting other dairying nations?
Thursday, 11 November 2021
By Patty Clayton
In September, inflation in agricultural inputs had reached its second highest rate, according to the Anglican Farmers’ Aginflation index. For dairy, input costs rose by around 25% between September 2020 and September 2021. Rising costs are impacting all of the key cost categories of feed, fuel and fertiliser, with those affected by energy prices recording the most extreme increases.
These cost increases are not unique to the UK however, nor even to Europe. As energy markets operate at a global level, the spike in prices is having an impact on agricultural input costs across the globe.
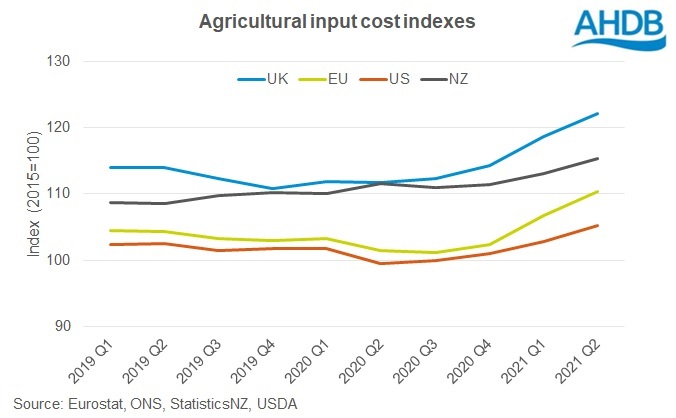
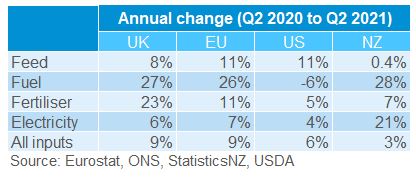
Comparing input cost indexes across the four key dairy regions, which measure the rate of change in prices paid, it is noticeable that the trends are very similar. On average, input costs have increased by 6-9% between June 2020 and 2021[1] in the US, EU and the UK. New Zealand has seen the lowest level of inflation in the period at 3%, due to their low exposure to feed costs.

Other notable differences are the relatively low rates of cost inflation in the US for fuel, fertiliser and electricity and the relatively rapid rise in fertiliser prices in the UK.
In the US, their high degree of self-sufficiency for energy will have helped to mitigate the impact of rising global prices for energy-related inputs. That said, some of these price increases are now starting to appear, with the September monthly indexes for fuel and fertiliser showing year on year increases of 18% and 31% respectively.
The notably higher price rises for fertiliser in the UK will be a function of the lack of domestic capacity and reliance on imports. This exposes the UK to global markets, where short supplies and strong demand as the world reopens after the pandemic are pushing up gas prices.
[1] Data is not yet available beyond June 2021 for all four regions to allow for comparisons.
Sign up to receive the latest information from AHDB.
While AHDB seeks to ensure that the information contained on this webpage is accurate at the time of publication, no warranty is given in respect of the information and data provided. You are responsible for how you use the information. To the maximum extent permitted by law, AHDB accepts no liability for loss, damage or injury howsoever caused or suffered (including that caused by negligence) directly or indirectly in relation to the information or data provided in this publication.
All intellectual property rights in the information and data on this webpage belong to or are licensed by AHDB. You are authorised to use such information for your internal business purposes only and you must not provide this information to any other third parties, including further publication of the information, or for commercial gain in any way whatsoever without the prior written permission of AHDB for each third party disclosure, publication or commercial arrangement. For more information, please see our Terms of Use and Privacy Notice or contact the Director of Corporate Affairs at info@ahdb.org.uk © Agriculture and Horticulture Development Board. All rights reserved.


