- Home
- News
- How have the USDA stocks and acreage reports influenced prices over the last decade? Grain market daily
How have the USDA stocks and acreage reports influenced prices over the last decade? Grain market daily
Wednesday, 31 March 2021
Market Commentary
- UK feed wheat futures (May-21) have lost £5.75/t since Friday’s close, closing last night at £190.00/t. New crop (Nov-21) has also lost ground since Friday, although only £2.90/t, closing last night at £161.25/t.
- US soyabean futures (nearby) are on track for their first monthly loss since May 2020. This is due to improving weather in South America and expectations of increased US plantings in tonight’s USDA predicted plantings report.
- Ukrainian wheat exports have fallen to a 5-month low on the back of limited demand. The maize area in Ukraine could fall by 14% according to consultancy APK-Inform, the largest reductions are seen in areas worst hit by droughts in 2020.
- Oil prices fell by over 1% yesterday after the reopening of the Suez Canal and a rally in the strength of the US dollar.
How have the USDA stocks and acreage reports influenced prices over the last decade?
Tonight, the USDA will release the annual US prospective plantings report and the quarterly US stocks report. Markets are relatively quiet at the moment, with the exception of soyabeans yesterday. As a result, these reports could be key to market sentiment in the short term.
What is the expectation for tonight’s reports?
Looking forward to the release tonight, Refinitiv trade estimates peg stocks for all three commodities lower than at the same point in 2020. The average trade estimate for maize is currently,197Mt compared to 202Mt in the previous season and a drawdown of 91Mt since December 2020.
The average trade estimate for wheat is 35Mt, versus 39Mt this time last year. Soyabean estimates are sharply lower, at 42Mt compared to last year’s figure of 61Mt.
With large cuts to stocks expected by trade, if cuts are less severe we could see further pressure on prices in the short term.
The prospective plantings of maize, wheat and soyabeans are estimated by trade to be up on the year, and on the early suggestions from February’s USDA outlook. Maize is estimated at 37.7Mha, compared to 36.8Mha last year and February’s estimate of 37.2Mha.
All wheat acreage is estimated to be slightly higher than the 17.96Mha estimated in 2020, pegged at an average of 18.2Mha. Soyabeans are sharply up year-on-year, with average trade estimates at 36.4Mha, compared with the March 2020 estimate of 33.62Mha. However, trade estimates are broadly in line with figures given at February’s USDA outlook conference.
Should we see increased acreage for maize, above what is expected by the trade, we could see increased pressure on prices. New crop Chicago maize futures have been tracking down over the past month.
What have previous reports meant for markets?
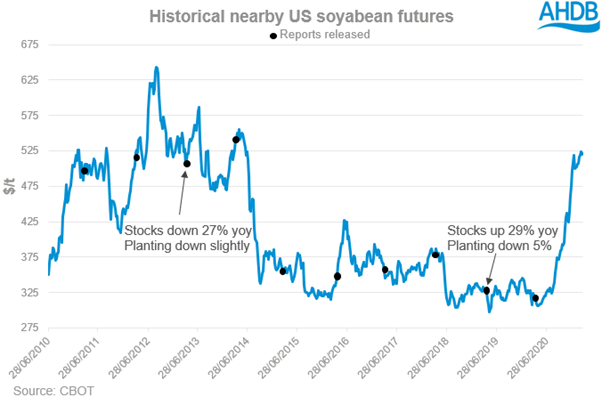
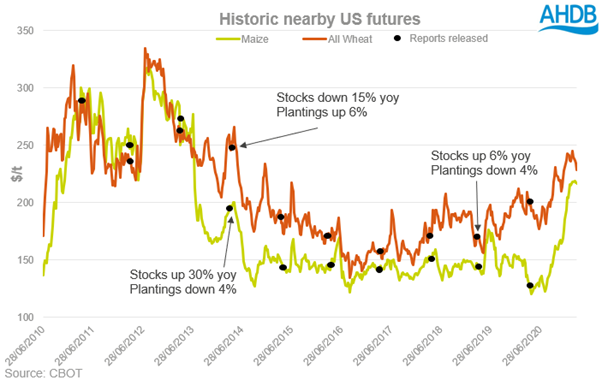
I have looked at the outcome of USDA stocks and acreage reports since 2010 to see how they have affected the price movement of nearby Chicago futures for wheat, maize and soyabeans.
The March release often brings some surprises and can cause markets to move in a big way. Looking at soyabeans and maize, apart from last year, in the previous 14 years at least one of the contracts had moved 2% or more on the day of the release.

In 2013, soyabeans rallied hard after the March stocks report showed stocks down 27% year–on-year, with predicted plantings roughly the same as the previous season.
The opposite happened in 2019, when soyabean stocks were forecast up 29%. However, in 2019 plantings were expected to be down 5%, which could have played a part in preventing prices falling too low.
These reports have also played a part in reversing market sentiment. In 2014, wheat enjoyed a strong rally from the end of January to mid-March. However, this rally ran out of steam and prices started backing off. Then, the stocks report pegged wheat stocks down 15%, which led to a rise in prices in the short term.

In some years, it would seem that there is very little impact after the release of these reports. This could be because the information wasn’t a surprise and was already priced in, or there were other fundamentals already underpinning the market. For instance, in 2015, soyabean stocks were estimated at 34% higher year-on-year with a similar acreage forecast, and yet the market did not really seem to respond to this news.
Another reason could be that one report was bullish, and the other bearish, effectively cancelling each other out. An example of this, would be in 2016 for wheat. The acreage was predicted to be 9% lower year-on-year; stocks were up 20%. Because of this, prices were relatively unchanged in the following weeks.
Sign up for regular updates
You can subscribe to receive Grain Market Daily straight to your inbox. Simply fill in your contact details on our online form and select the information you wish to receive.
While AHDB seeks to ensure that the information contained on this webpage is accurate at the time of publication, no warranty is given in respect of the information and data provided. You are responsible for how you use the information. To the maximum extent permitted by law, AHDB accepts no liability for loss, damage or injury howsoever caused or suffered (including that caused by negligence) directly or indirectly in relation to the information or data provided in this publication.
All intellectual property rights in the information and data on this webpage belong to or are licensed by AHDB. You are authorised to use such information for your internal business purposes only and you must not provide this information to any other third parties, including further publication of the information, or for commercial gain in any way whatsoever without the prior written permission of AHDB for each third party disclosure, publication or commercial arrangement. For more information, please see our Terms of Use and Privacy Notice or contact the Director of Corporate Affairs at info@ahdb.org.uk © Agriculture and Horticulture Development Board. All rights reserved.

