- Home
- Historic light leaf spot forecasts (harvest years 2015–21)
Historic light leaf spot forecasts (harvest years 2015–21)
These historic forecasts show the proportion of the oilseed rape crop (disease resistance rating of 5) estimated to have more than 25% of plants affected by light leaf spot in the spring. Shown on a series of static GB maps, it captures forecast risk for harvest years 2015–21.
Issued in March, the final forecasts used previous season pod incidence data, deviation from the 30-year mean summer (July/August) temperature data and deviation in winter rainfall from the 30-year mean.
From 2021–22 onwards, an updated model and new dynamic visualisation tool were used to present the forecast.
Access the latest light leaf spot forecast
Forecast facts
Autumn fungicide
The forecast is based on no autumn fungicide.
Typically, a well-timed application of an appropriate autumn fungicide – at a sufficient dose – has a relatively large impact on the final light leaf spot levels in a crop. However, when disease risk is low, the effect is much less. In very low-risk situations (determined by observations of field-level risk), there is potential to reduce fungicide dose or omit some sprays – provided the strategy adopted also controls phoma sufficiently.
Sowing date
The forecast is based on a sowing date in the week centred on 1 September.
The effect of sowing date on predicted light leaf spot levels is moderate – with early sowings (mid-August) increasing prevalence and later sowings (mid-September onwards) decreasing prevalence. Once again, the effect is smallest when risk is relatively low.
Varietal resistance
The forecast is based on a resistance rating of 5.
Cultivar resistance has a significant effect on predicted light leaf spot prevalence. When the forecasts were first developed (based on data from 1987–99), ‘5’ was a moderate resistance rating. However, most current varieties are more resistant.
The maps
The forecast illustrates risks via five coloured bands on a GB map.
The map shows the proportion of the oilseed rape crop estimated to have more than 25% of plants affected by light leaf spot in the spring.
The regions are derived from an analysis of historic survey data for light leaf spot incidence (percentage of plants affected) in March/April.
|
0–14% |
15–29% |
30–44% |
45–59% |
>60% |
|
|
|
|
|
|
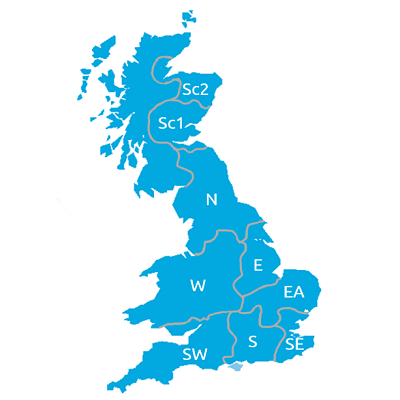
Light leaf spot regions

SW (South West): Cornwall, Devon, Dorset, Gloucestershire, Somerset, Wiltshire and South Wales.
S (South): Berkshire, Buckinghamshire, Hampshire, Oxfordshire, Surrey and West Sussex.
SE (South East): East Sussex, Essex and Kent.
W (West): Cheshire, Derbyshire, Hereford and Worcester, Shropshire, South Yorkshire, Staffordshire, Warwickshire, West Midlands, Mid-Wales and North Wales.
EA (East Anglia): Bedfordshire, Cambridgeshire, Hertfordshire, Norfolk, Northamptonshire and Suffolk.
E (East): Humberside, Leicestershire, Lincolnshire and Nottinghamshire.
N (North): Cleveland, Cumbria, Durham, Lancashire, Northumberland, North Yorkshire, Tyne and Wear, and West Yorkshire.
Sc1 (Scotland – South)
Sc2 (Scotland – North)
2021/22*
.PNG) AHDB
AHDB
For harvest 2022, an updated model and new dynamic visualisation tool were used to present the forecast. It allowed changes to risk to be estimated over the winter period.
2020/21
.PNG)
2019/20
.PNG)
2018/19
.PNG)
2017/18
.PNG)
2016/17
.PNG)
2015/16
.PNG)


.PNG)
 ADAS.jpg?v=638035141710000000)
 CropShots.jpg?v=637780281650000000)