- Home
- How much of each agri-food product does the UK produce?
How much of each agri-food product does the UK produce?
When examining the UK’s potential to maximise exports, it’s important to determine how much the UK produces of each agri-food product and how much is available to export. Continuity of supply is important when developing export relationships, as a customer wants the security of knowing that they will have a reliable source of product.
The supply-demand balance for red meat is not as straightforward as that for dairy and cereals because of carcase balance. There may be higher domestic demand for particular cuts of meat, meaning different parts of the animal will be in surplus or deficit. Maximum value for UK red meat can be achieved by exporting cuts and products that are not in high demand in the UK to export markets where there is demand for that product. Meat offal is a classic example of this.
Beef
Beef production depends on the size of the beef suckler and dairy herds. Together, these comprise the total breeding herd. Roughly 50% of production comes from the dairy herd. Production has increased mainly due to more viable animals being available from the dairy supply chain for beef production.
The total UK breeding herd for cattle fell by 5% between June 2012 and June 2022 to 3.3 million due to lower long-term profitability in the suckler herd. The dairy herd increased by 2.5% over the same period. UK cattle slaughterings averaged 2 million between 2018 and 2022.
UK beef production averaged 909,000 tonnes between 2018 and 2022.
Between 2021 and 2022, mince was the highest purchased beef product by volume in a retail setting, followed by processed beef, burgers and grills. The total amount of beef purchased in the GB retail market between 25 December 2021 and 25 December 2022 was 581 Kt (Kantar).
The UK is a net importer of beef; total beef imports averaged 247 Kt between 2017 and 2021, while total beef exports averaged 114 Kt over the same period.
Sheep meat
The overall UK flock increased from 32.2 million in June 2012 to 34.8 million in June 2017, before falling back to 33.1 million in 2022, an overall increase of 2.6% over the decade. This is due to improved profitability in the sheep flock, helped by favourable weather and environmental conditions which improved the quality of lambs.
UK production of mutton and lamb averaged 287 Kt between 2018 and 2022.
Between 2021 and 2022, leg roasting joints were by far the highest-purchased lamb cut by volume and value in a GB retail setting. Lamb chops, mince and steak were also popular, but volumes sold were considerably less than that of roasting joints. The total amount of lamb purchased in the GB retail market between 25 December 2021 and 25 December 2022 was 81 Kt (Kantar).
The UK is a net exporter of sheep meat, averaging 85 Kt a year between 2017 and 2021, while sheep meat imports averaged 63 Kt over the same period. The UK mainly exports carcases to the EU, and imports joints/legs from New Zealand.
Pork
The UK female breeding herd decreased by 19% from 425,200 head in June 2012 to 342,803 in June 2022 (Figure 1). This decline was due to overarching difficulties within the sector in recent years. Rising input costs stemming from the war in Ukraine increased the cost of production. Similarly, the increased cost of fertiliser, and wider market forces, saw a rise in the cost of feed.
Figure 1. UK female pig breeding herd size from 2012–22

Source: Defra
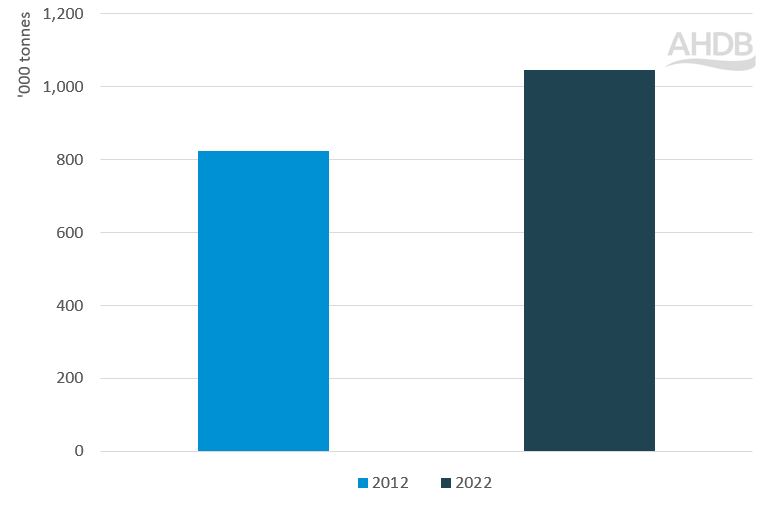
However, over the same period pig meat production levels have steadily increased by 27%: from 825 Kt in 2012, to 1,050 Kt in 2022 (Figure 2). The uptick in production levels is due to recent higher pig carcase weights, a consequence of pigs being retained on farm due to supply chain disruption and lower prices.
Figure 2. Pork production in the UK

Source: Defra
Processed pork ‒ such as sausages, sliced cooked meats and bacon ‒ were the highest pork purchases by volume in the GB retail sector between 2021 and 2022. The total amount of pork bought in the GB retail market between 25 December 2021 and 25 December 2022 was 952 Kt (Kantar).
The UK is a net importer of pig meat, averaging 395 Kt per year between 2017 and 2021, while total pig meat exports averaged 225 Kt over the same period.
Dairy
The UK milking herd increased by 2.5% from 1.796 million in June 2012, to 1.842 million in June 2022. The volume of milk produced over the past decade has increased by around 9% due to higher milk yields – a consequence of genetic and nutritional improvements.
Figure 3. Size of UK dairy herd and milk yield

Source: Defra
The main dairy products exported from the UK are butter and cheese. While there are also some exports of milk powders, limitations in processing capacity and its relatively low value mean there are fewer opportunities for export growth than higher value cheese and butter. Due to its short shelf-life and high transport costs, liquid milk is not exported from the mainland. There are some reported exports due to the movement of milk across the border from Northern Ireland to the Republic of Ireland.
In terms of trade balances, the UK is a net importer of butter and cheese but runs a trade surplus in milk powders. Total powder exports averaged 138 Kt a year between 2017 and 2021, while total imports averaged 92 Kt over the same period.
For butter, imports averaged 78 Kt between 2017 and 2021, while exports averaged 60 Kt over the same period. Investments in butter processing capacity in recent years, along with shifts in trading patterns for bulk cream, have resulted in a gradual decline in imports. By 2021, the trade deficit was just 5 Kt, compared to 36 Kt five years earlier.
The UK is also a net importer of cheese, averaging 493 Kt per year between 2017 and 2021, while exports averaged 183 Kt over the same period. Production has been steadily increasing, from 395 Kt a year in 2011 to 503 Kt in 2021 (27% higher).
Kantar data shows that the volume of cheese purchased in the GB retail sector, between 26 December 2021 and 25 December 2022, was 501.4Kt (4.7% lower year on year). This is mainly due to reduced imports in 2020 and 2021 as COVID-19 lockdowns closed off out-of-home markets, which are the main destination for imported products. Domestic cheese production is more geared to retail markets but is insufficient to meet total retail demand.
Wheat
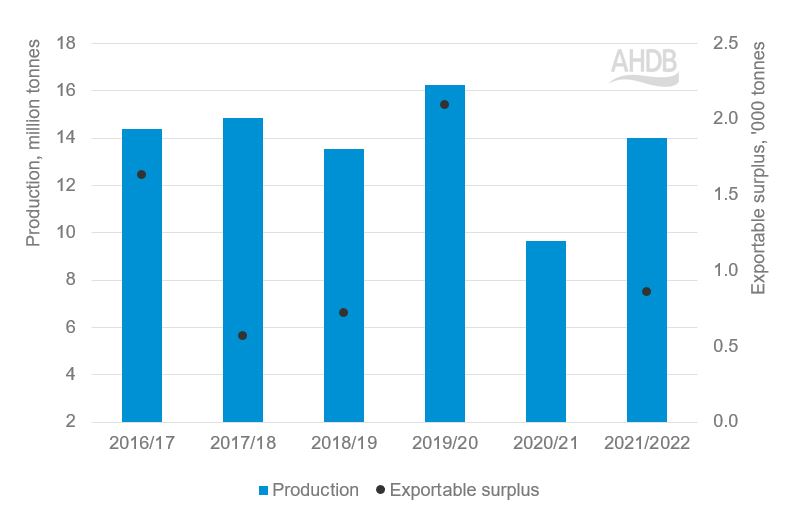
UK wheat production has averaged around 14 Mt over the past decade, but from year to year there can be fluctuations depending on the weather. For example, Figure 4 shows how between the 2019/20 and 2020/21 crop years, the UK wheat harvest fell from 16.2 Mt to 9.7 Mt, a decline of 40%.
The UK has been a net importer of wheat seven times in the past 10 years (2012–2021). Even in years where the UK produces a bumper crop, a certain level of imports will always be required. This is because the milling sector requires a proportion of high-protein wheat that cannot be grown domestically, to ensure continuity in the grist. High-protein hard wheat for milling is imported from Canada, France and Germany.
On average UK flour millers use 80% homegrown wheat and 20% imported wheat each year, but these proportions change depending on the quality and quantity of the domestic crop.
Figure 4. UK wheat production and exportable surplus

Source: Defra, AHDB
As Figure 4 shows, the exportable surplus of wheat (the amount left over once domestic demand and stock requirements have been taken into account) also fluctuates considerably. These factors, combined with other issues (such as tough competition from big global producers) mean that the UK is unlikely to become a major wheat exporter any time soon.
However, there are opportunities in the niche soft wheat market. UK soft wheat is favoured by Spain, Portugal and Morocco – especially when there is a disruption to supply.
A challenge for the UK is that soft wheat area has been declining as farmers prefer to grow higher-yielding varieties. Soft wheat area is on average around 20% of the UK wheat area.
Barley
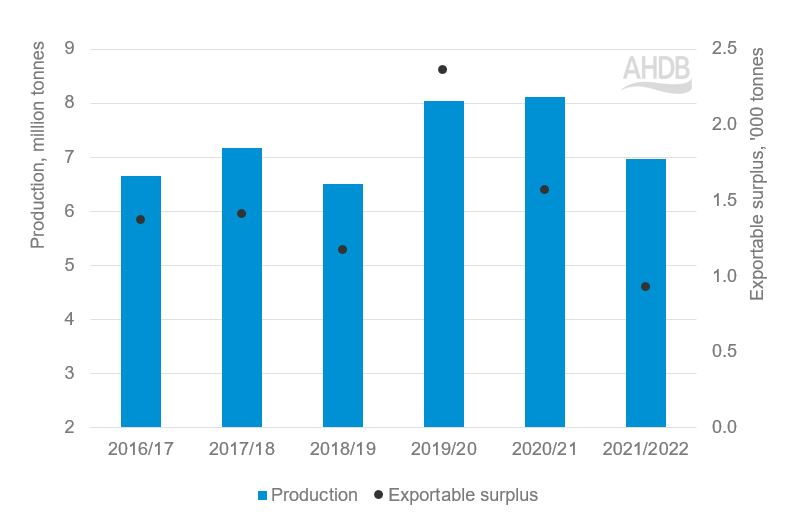
UK barley production has averaged around 7 Mt over the past decade. Output has been fairly stable, varying between 6 and 8 Mt. The UK is a net exporter of barley and the exportable surplus is usually over, or close to, 1,000 t (Figure 5).
Figure 5. UK barley production and exportable surplus

Source: Defra, AHDB
Spring barley dominates over winter varieties, comprising around 65% of the total UK barley area. Most of the barley produced is used for animal feed (4.3 Mt based on 2016/2017–2021/22 average), with around 1.8 Mt consumed by the UK malting sector.
The UK’s exportable surplus of barley is around 1.5 Kt on average (2016/17–2021/22). Key markets include the EU for both feed and malting barley and the Middle East and North Africa region for feed barley.

