- Home
- Who are the UK’s key competitors?
Who are the UK’s key competitors?
The UK faces stiff competition from other agri-food exporters, who may have the upper hand in economies of scale, price competitiveness, geography, and market access. Here we examine the UK’s rivals for export markets by sector and geographical region.
We compared the UK’s relative cost of production for various agri-food products with key competitors, using data from agri benchmark, unless otherwise stated.
While relative production costs have a bearing on the competitiveness of UK exports, other factors (market access, preferential tariffs, matching consumer demand to products on offer, and establishing networks and relationships) also influence global trade flows. The data used in this section refers to the 2019–2021 average.
About agri benchmark
Agri benchmark is a global non-profit network of agricultural economists, advisors, producers and specialists in key sectors of agriculture. It uses internationally standardised methods to analyse farms, production systems and their profitability. Typical farms within a country are established in consultation with a focus group of farmers in the main areas of relevant production. Local farmers and advisors identify the standard size, enterprises, resources, inputs, outputs and operation of farms in a particular area.
Beef
Based on the 2019–2021 average, Brazil is the leading global beef exporter (Figure 1). During this period, almost 60% of Brazil’s fresh/chilled beef exports were sent to Chile and Uruguay. Frozen beef exports were primarily shipped to China (just under 50%). Hong Kong and Egypt were the next most prominent destinations, accounting for 13% and 8% of frozen beef exports, respectively.
Australia was the second-highest beef exporter in the world. Over a third of Australia’s fresh/chilled beef exports were sent to Japan (38%), with a fifth shipped to the USA and around 11% exported to South Korea and China. For Australian frozen beef exports, the Asian market was the key destination, with China as the primary market, but substantial amounts were sent to other countries, including South Korea, Japan and Indonesia. The USA was the only country in the top 10 destinations for Australian frozen beef exports outside of Asia.
Figure 1. Top global beef exporters (2019–2021 average)
Source: Compiled by Trade Data Monitor LLC
On average, Japan, Mexico and South Korea were the top three destinations for US fresh/chilled beef exports between 2019 and 2021. Asia was also the primary market for frozen US beef, with South Korea, China, Japan, Taiwan (Republic of China) and Hong Kong as the top five markets.
Almost 90% of Argentine frozen beef exports were sent to China (2019–2021 average), while fresh/chilled beef was mainly exported to Chile and the European Union (EU).
Over 75% of New Zealand’s frozen beef exports were shipped to China and the USA. Fresh/chilled products dominate EU exports, with the UK and other non-EU European countries the primary recipients. Similarly, the bulk (90%) of Canadian fresh/chilled beef exports were destined for the USA.
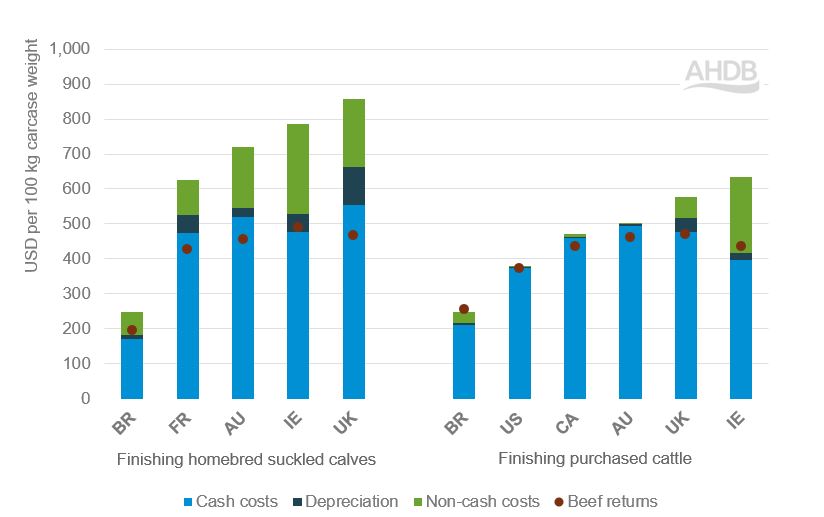
In terms of cost of production, Figure 2 shows how UK beef finishing production costs compare with those in Brazil, France, Australia and Ireland for homebred cattle and with Brazil, the USA, Canada, Australia and Ireland for purchased cattle. In both cases, the UK’s full economic production costs are among the highest shown. Production costs in Brazil are markedly lower, although so are returns. Nevertheless, Brazil’s beef production is more profitable than the other countries shown. Similarly, for purchased finishing cattle (cattle that are not homebred but bought in), the USA, Canada, and Australia have higher returns relative to production costs compared with the UK and Ireland.
Figure 2. Typical beef finishing production costs and returns (2019–2021 average)
Source: agri benchmark, AHDB
Pork
The EU is the top pork exporter in the world. It exported an average of just under 3.5 Mt per year between 2019 and 2021 (Figure 3). China was the leading destination for EU pork exports, with over half of the total pork exports sent there. The UK, Japan and South Korea were also among the top four destinations for EU pork exports, accounting for 11%, 9% and 6% of total exports in the same period, respectively.
Figure 3. Top global pork exporters (2019–2021 average)
Source: Compiled by Trade Data Monitor LLC
The USA was the second-largest pork exporter based on the 2019–2021 average, and Mexico was the leading destination (accounting for an average of 28% of total US exports annually). Fresh/chilled pork comprised over 90% of total pork exports to Mexico. Japan and China were also in the top three destinations for US pork exports.
Just under a third of Canadian pork exports per year were shipped to China between 2019 and 2021. The USA and Japan were also in the top three destinations, accounting for 22% and 20% of total pork exports, respectively, over the same period. Most of the pork exported to the USA is fresh/chilled product. Canada’s pork exports to China spiked to over 500 Kt in 2020 (compared to the 200–250 Kt exported in preceding years) due to China importing more pork during the outbreak of African swine fever (ASF). The volumes of Canadian pork sent to China have receded. They were less than 200 Kt in 2022.
The Asian market is the primary destination for Brazil’s pork exports. China is the main recipient, accounting for just under half of Brazil’s total pork exports (2019–2021 average). Hong Kong, Singapore and Vietnam are also key markets. In South America, Chile and Uruguay are the main customers of Brazilian pork.
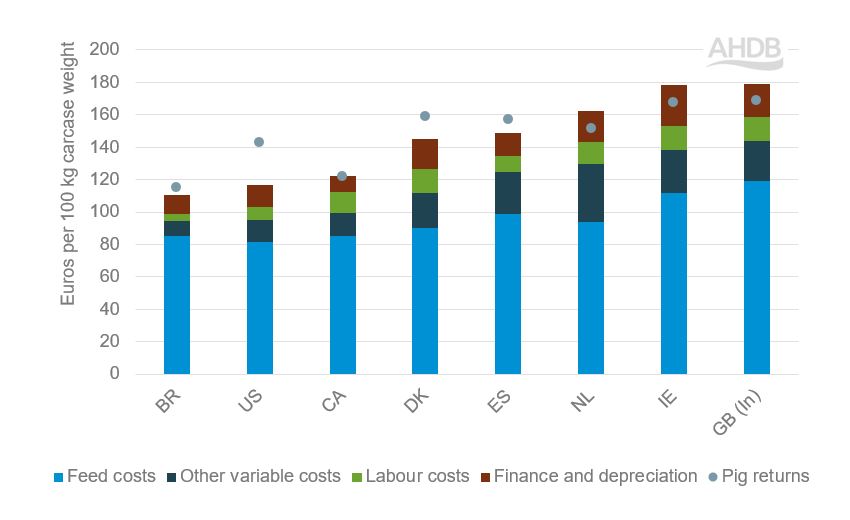
Figure 4 shows the cost of producing indoor-reared pork in GB compared with that in Brazil, the USA, Canada and various EU countries. InterPig, the source of this data, is a joint project with institutions from 17 countries.
Figure 4. Typical pig production costs and returns (2019–2021 average)
Source: InterPig, AHDB
Pig production costs in GB are the highest among the top global pork exporters (Figure 4), particularly feed costs. Furthermore, returns from pig production are less than costs (as is the case in the Netherlands and Ireland). Canadian pork production just about breaks even in terms of costs and revenue. Out of the countries shown in Figure 4, pig production is the most profitable in the USA, Denmark, Spain and Brazil.
Sheep meat
Australia and New Zealand are the dominant sheep meat exporters in the world. Between 2019 and 2021, Australia exported over 450 Kt of sheep meat per year on average (44% of global sheep meat exports), while New Zealand exported over 390 Kt (38% of global exports).
China and the USA are the main export destinations for Australian sheep meat, accounting for 35% and 18% of the country’s sheep meat exports (2019–2021 average). Markets in Asia and the Middle East are also key customers.
New Zealand’s sheep meat exports are predominantly sent to China, with an average of 56% of sheep meat exports shipped to the country between 2019 and 2021. The UK and USA were also in the top three export destinations for New Zealand sheep meat over the same period, accounting for 9% and 6% of exports, respectively. The EU is also an important market for New Zealand sheep meat. New Zealand has access to a tariff rate quota (TRQ), which allows it to send over 114 Kt of sheep meat to the UK tariff-free. In recent years, however, utilisation of the quota has only been at around 40%. A similar TRQ is in place for EU sheep meat imports from New Zealand.
The UK was the third largest global sheep meat exporter (2019–2021 average), with most exports sent to the EU.
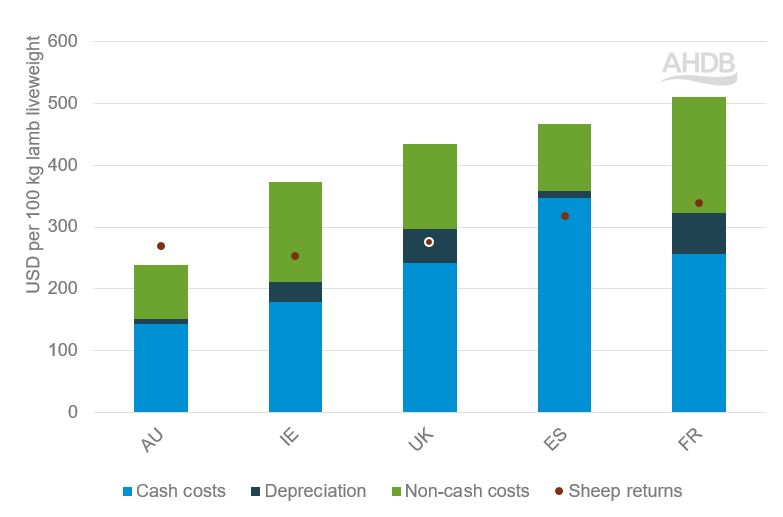
Figure 5. Typical sheep production costs and returns (2019–2021 average)
Source: agri benchmark, AHDB
Figure 5 shows the costs and returns associated with sheep farming in Australia, Ireland, the UK, Spain and France. New Zealand is not featured as it is not part of the agri benchmark network. Australia’s production costs are markedly lower than its European competitors, and sheep farming is more profitable there than in the other countries shown.
Dairy
New Zealand and the EU are the key global dairy exporters in terms of butter, milk powders and cheese (USDA).
New Zealand was responsible for an average of over 70% of global whole milk powder exports between 2019 and 2021 and an average of 46% of global butter exports over the same period. China and Australia were the main destinations for New Zealand butter, along with other Asian markets and the USA.
The EU was the top cheese exporter between 2019 and 2021, accounting for just under half of global exports and was the second-largest butter exporter (38% of global exports). The UK, USA and Japan were the top three destinations for EU cheese exports between 2019 and 2021. China, Canada, Australia and the Middle East and North Africa (MENA) region are also important markets for EU cheese exports.
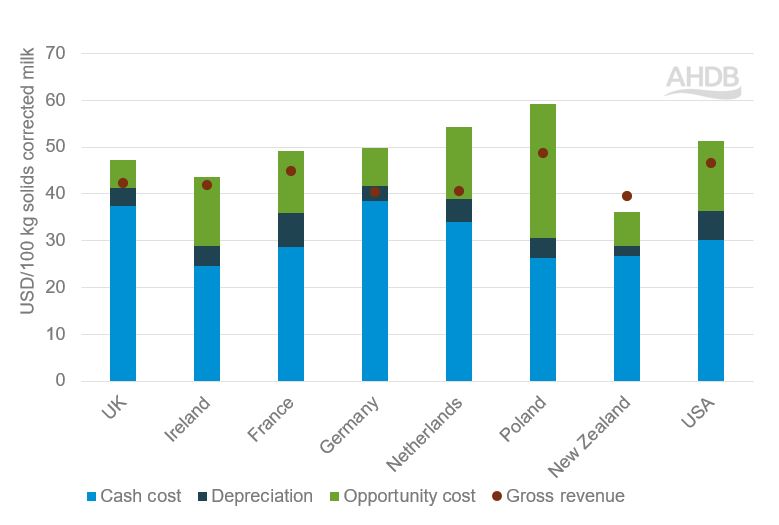
Figure 6. Typical costs of milk production and revenue (2019–2021 average)
Source: IFCN
Figure 6 compares typical costs and revenue associated with milk production in the UK with that in EU countries, New Zealand and the USA. Data from the International Farm Comparison Network (IFCN) is used whereby each country or dairy-producing region is represented by farms which are typical for that area, allowing benchmarking in more than 50 dairy-producing countries across the globe.
Milk production in New Zealand had the lowest cost of production (2019–2021 average), with gross revenue above costs. The UK had the third lowest production costs after New Zealand and Ireland but one of the highest cash costs of the countries shown. New Zealand milk production carries lower costs than that in the UK, which gives it the advantage of being more competitive in export markets.
Wheat
Based on the 2019–2021 average, Russia was the world’s leading wheat exporter, shipping over 34 Mt per year (Figure 7). Turkey and Egypt were the main destinations for Russian wheat during this period, with 7.2 Mt and 6.7 Mt exported to these countries, respectively. The Russia-Ukraine war, which broke out in early 2022, has since disrupted wheat exports from Russia.
Around half of EU wheat exports were destined for the MENA region over this period; Algeria, Morocco and Egypt were the top three export markets. Outside of MENA, China is a key destination for EU wheat.
Mexico and Asian countries such as the Philippines, Japan, South Korea, Taiwan and China were the main customers of US wheat between 2019 and 2021. Similarly, a considerable proportion of Canadian wheat exports were sent to Asia: China, Japan, Indonesia and Bangladesh accounted for over 30% of its wheat exports.
Figure 7. Top global wheat exporters (2019–2021 average)
Source: Compiled by Trade Data Monitor LLC
Ukraine was the fifth-largest wheat exporter between 2019 and 2021; Egypt, Indonesia, Bangladesh and Turkey were the top four export destinations. As is the case for Russia, Ukraine’s exports have been affected negatively by the breakout of the Russia-Ukraine war in 2022.
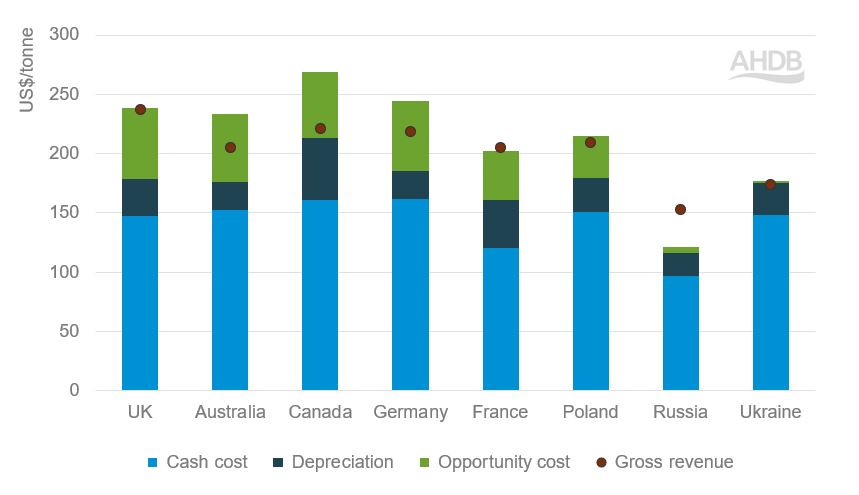
Figure 8 shows how the UK’s cost of production for wheat compares with the world’s leading exporters based on the 2019–2021 average. Out of the countries shown, only Canada and Germany had higher overall costs during this period. Wheat production in Russia was the most profitable and had the lowest production costs.
Figure 8. Average* cost of production and revenue for wheat (2019–2021 average)
*Average of representative farms in a given country, not the national average
Source: agri benchmark
Barley
The EU is the world's largest barley exporter. It exported an average of 7.4 Mt of barley per year between 2019 and 2021. Just under a third of EU barley exports were sent to China, and under a quarter were exported to Saudi Arabia.
Saudi Arabia was the top export market for Australia over the same period, with 24% of Australian barley exports sent to the country. Japan was the next main destination for Australian barley (16% of total exports), followed by Vietnam and Thailand.
Russia was the third-largest global barley exporter between 2019 and 2021; the MENA region was the main destination. Saudi Arabia accounted for around a third of Russian barley exports during this period; Libya, Tunisia, Jordan and Israel were also important markets. An average of 589 Kt per year of barley was also shipped to Turkey.
Ukraine’s barley exports were slightly lower than Russia’s over this period, with China the main customer (over 40% of total exports). Like Russia, the MENA region was a key destination for Ukraine barley.
Figure 9. Top global barley exporters (2019–2021 average)
Source: Compiled by Trade Data Monitor LLC
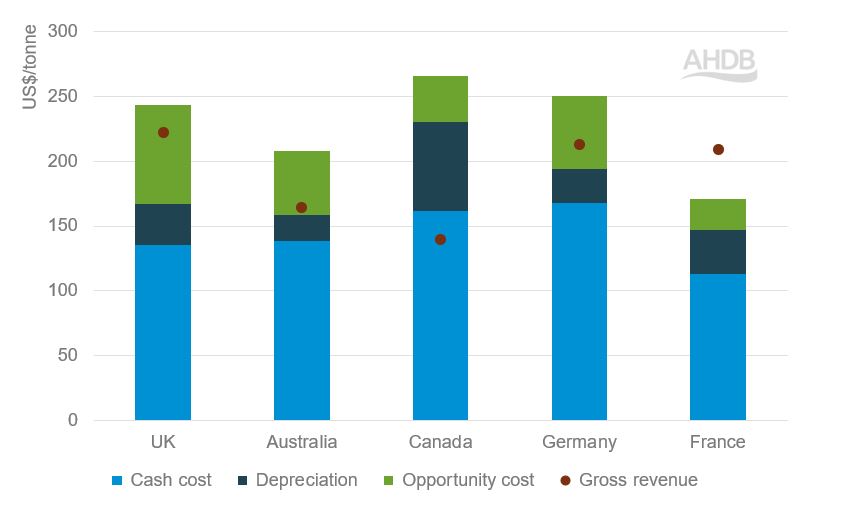
Figure 10 shows how the average cost of production for barley in the UK compares with that in Australia, Canada, Germany and France. While the UK’s cost of production was higher than in France and Australia, higher gross revenue meant that barley production in the UK was more profitable than in Australia. Of the countries shown in Figure 10, barley production was the most profitable in France.
Figure 10. Average* cost of production and revenue for barley (2019–2021 average)
*Average of representative farms in a given country, not the national average
Source: agri benchmark


