Lightening your overheads
Wednesday, 15 July 2020
By Kate Parkes
Nearly half of revenue goes on overheads…
Challenging your costs can help get your business through challenging times – as we saw in our recent article. Almost half of the dairy farm’s revenue is typically spent on overheads, so it’s worth making every effort to squeeze down those costs.
Bear in mind reducing overheads is a longer-term strategy that can help your business withstand future milk price shocks. If you’re looking for more urgent, short-term options for cutting costs, take a look at our trimming costs page.
Lower overheads, higher profit
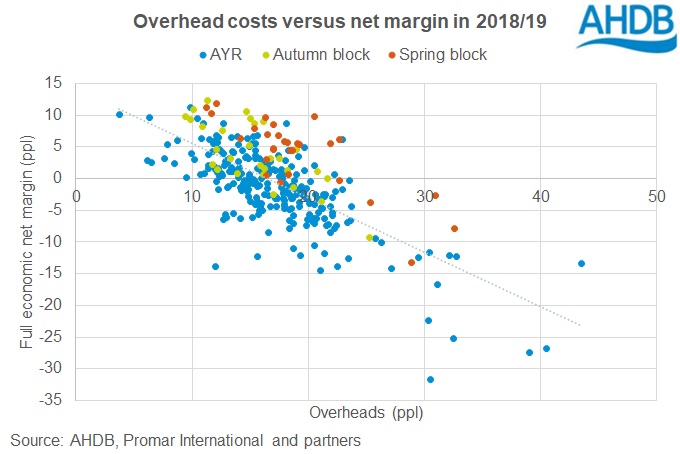
Higher profit margins are associated with lower overhead costs, no matter what calving system you operate – the chart below shows this with overhead costs versus net margin for 316 GB dairy herds. Minimising overhead costs is a characteristic of top performing farms across all sectors, not just in dairy. Getting familiar with your overheads and reviewing them can help you gain more control over your net margin.

Breaking down overheads
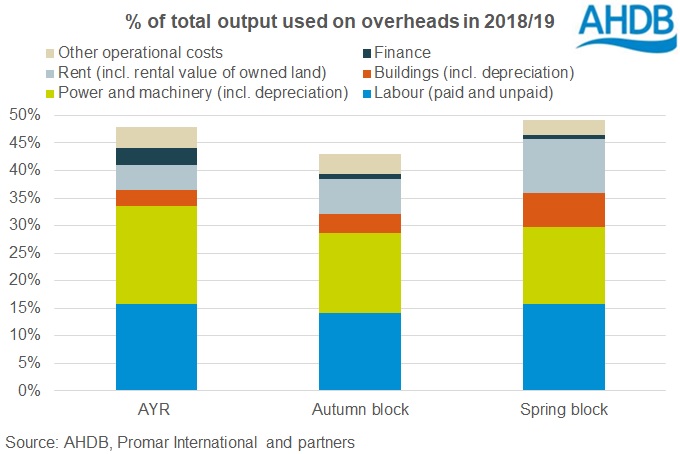
This chart shows how much of the herd’s revenue is typically spent on each area of overhead cost, using figures from mid-performing herds in 2018/19. Around 15% of the dairy herd’s income is spent on labour, and about the same again goes on machinery and power.

Starting points for reviewing overheads
Although overheads are sometimes referred to as ‘fixed costs’, you can take action to reduce them and/or find more efficient ways of running things. It requires some longer-term planning but the goal is to improve margins for future years.
We have some resources that can help you compare your herd with figures from the most productive and profitable British dairy herds – to find out where you might be able to manage overheads better and gain more control over your margin:
- Review your costs using our Trimming costs page
- Find where you can make the biggest improvements, by comparing with our Dairy performance results 2018/19
- Find efficiencies with inspiration and ideas from others – our online events include webinars with our strategic farms, consultants, vets and more
A note on full economic costs
The costs shown here are full economic production costs, which means they include all non-cash costs to the business. These are the costs you can’t see going out of your bank account – machinery and buildings depreciation, unpaid labour and the rental value of owned land.
Always include your non-cash costs when reviewing and planning. If you don’t factor them in you can find yourself short after a few years of depreciation have set in, and your figures won’t be directly comparable with published data.
Sign up to receive the latest information from AHDB.
While AHDB seeks to ensure that the information contained on this webpage is accurate at the time of publication, no warranty is given in respect of the information and data provided. You are responsible for how you use the information. To the maximum extent permitted by law, AHDB accepts no liability for loss, damage or injury howsoever caused or suffered (including that caused by negligence) directly or indirectly in relation to the information or data provided in this publication.
All intellectual property rights in the information and data on this webpage belong to or are licensed by AHDB. You are authorised to use such information for your internal business purposes only and you must not provide this information to any other third parties, including further publication of the information, or for commercial gain in any way whatsoever without the prior written permission of AHDB for each third party disclosure, publication or commercial arrangement. For more information, please see our Terms of Use and Privacy Notice or contact the Director of Corporate Affairs at info@ahdb.org.uk © Agriculture and Horticulture Development Board. All rights reserved.

