- Home
- Grain nutrient analysis and its role in management
Grain nutrient analysis and its role in management
Since the 2020 edition, RB209 has encouraged routine analysis of grain samples for specific nutrients. Arguably, the most accurate way to assess crop nutrient capture and offtake, the results will help you refine management plans.
In August 2020, Roger Sylvester-Bradley (ADAS) delivered an AHDB webinar on the topic. He explained how to carry out, analyse and use the results of grain analysis. He also outlined how, through the pooling of results and the provision of benchmarking data, the approach could help drive performance improvements across the UK.
The presentation led to a healthy debate, with the main questions and answers outlined in this article.
Grain nutrient analysis and benchmarking webinar
Key revisions in the 2020 edition of the AHDB Nutrient management guide (RB209)
RB209 for arable crops (section 4)
How does grain nutrient analysis relate to soil and leaf analysis?
Soil analysis results can help predict crop nutrient availability. Grain analysis can provide estimates of crop capture and use. A combination of soil and grain data can be used to identify constraints to productivity.
Yield Enhancement Network (YEN) data analysis has revealed the relationship between soil and grain nutrient levels for phosphorus (P) and potassium (K) (see image), with a four-colour, traffic-light system showing how each sample performed (relative to grain and soil thresholds).
- Green: Crop uptake and soil supply sufficient
- Orange: Crop uptake sufficient, soil supply insufficient
- Yellow: Crop uptake insufficient, soil supply sufficient
- Red: Crop uptake and soil supply insufficient
.PNG)
Where soil supply is sufficient but uptake is inefficient, it is particularly important to identify the reasons. Adding more of the deficient nutrient will not improve the situation. Inefficient uptake, despite reasonable supply, may be due to multiple causes, including poor rooting, waterlogging, suboptimal soil moisture and weed competition.
It has yet to be determined how tissue analysis fits into the story.
What are critical thresholds for grain nutrients?
Put simply, grain should ideally be above the critical thresholds (CTs) for nutrient content (in grain dry matter – DM). Set for many cereal nutrients, some CTs are more reliable. However, CTs are improving all the time, following greater adoption of the technique.
Critical thresholds (CT) in grain dry matter (DM)
| Reliable | CT | Uncertain | CT | Unknown |
| Nitrogen (N) | 1.9%* | Potassium (K) | 0.38% | Calcium (Ca) |
| Phosphorus (P) | 0.32% | Magnesium (Mg) | 0.08% | Iron (Fe) |
| Sulphur (S) | 0.12% | Zinc (Zn) | 15ppm | Boron (B) |
| Manganese (Mn) | 20ppm | Copper (Cu) | 2ppm | Molybdenum (Mo) |
What is the best way to sample grain?
It makes sense to harvest, sample and analyse field zones (e.g. soil management zones) separately. If this can’t be done with the combine, the next best thing is to use a handheld sample harvester (costs around £500).
See a hand combine in action (video)
The more samples taken from a zone, the more representative the sample will be. Many people will harvest field by field. In this situation, it is important to compare whole-field grain analysis with whole-field average soil nutrient levels.
Sampling grain after combining
- Ensure samples are representative of the field/zone.
- If there is no risk of injury, take a sample as the grain trailer is tipped – two half-cupfuls from each trailer.
- Put samples from each individual field/zone in a labelled bucket and mix thoroughly.
- Take 200 g of the mixed grain sample and put into a clearly labelled plastic bag (field/zone, name/code and date).
- Repeat steps 2–4 for each field/zone.
- Send samples to the laboratory for analysis (follow their guidance).
Discover more grain sampling tips
Where is grain analysis done and how much does it cost?
Although grain analysis is relatively new, it follows similar methods to tissue analysis, offered by most agricultural labs. Several labs already offer grain analysis at a cost of around £30 per sample. Grain analysis may also be included with some advisory services. For example, ADAS’ ‘YEN Nutrition’ package includes analysis and benchmarking of six grain samples.
Does grain moisture matter?
No. The labs dry samples before analysis and express the results on a dry-matter (DM) basis. For grain nutrient offtakes, it is assumed grain is at 15% moisture. Where actual moisture contents are known, adjust results accordingly.
How to interpret results
Use the grain analysis report to identify fields/zones with suspected nutrient deficiencies. Compare with potentially healthy fields/zones and with recent soil and tissue tests for the same fields/zones. Benchmarking fields/zones, in any season, allows you to see where your results sit in relation to the rest (e.g. other fields/zones). This could be across fields on your farm or data provided by other farmers. It pays to be patient when it comes to nutrient management and to avoid impulsive decisions. It is best to use results from routine analysis to build up a picture of individual farms/fields/zones over several years.
What about near-infrared (NIR) and nutrient measurement?
Widely used, near-infrared (NIR) offers an indirect method for grain N (grain protein) measurement. However, most UK labs do not use NIR to measure specific nutrients in grain, preferring the more direct Dumas method for grain N and inductively coupled plasma mass spectrometry (ICP-MS) for other nutrients.
Is there season-to-season variation in grain nutrients?
Due to the variability between fields (e.g. rotations and weather), the best assessments of seasonal effects use pooled data from multiple fields. Analysis of YEN data (harvests 2016–19) showed some modest seasonal effects. Most variation was observed in 2016 (sample size was relatively small) – in particular, P was high and B was low. Values were slightly higher in 2017 and slightly lower in 2019 – for example, K and Cu were both low in 2019. However, average values for other nutrients did not change much from year to year. Overall, no top-ten nutrient varied by more than 20% from its four-year average (with the exception of copper, which was just 23% less than its long-term average in 2019).
.PNG)
Note: Boron and molybdenum are present in small concentrations and omitted from the figure.
Are results corrected to account for yield variation?
No. High-yielding crops tend to grow more biomass and require more nutrients. Associations between grain yield and grain nutrients are frequently too small to detect robustly.
Does grain nutrient deficiency correspond with lower yields?
Yield variation is often extreme. For example, the variation among YEN crops ranges from around 6 to 16 t/ha. Hundreds of factors affect yields. Apart from the large effect of weather, the main factors for variation have been defined as: farm, previous crop, soil type, fertiliser/manure use and variety (listed in order of importance). Associations between grain yield and grain nutrients are frequently too small to detect robustly. Far more data is required (read: thousands, rather than hundreds, of yields) to detect subtle effects. The persistent differences between farms are particularly interesting. This may point to the importance of some aspects of management not formally recognised – ‘attention to detail’, is often suggested.
What about the influence of extremes?
As mentioned, weather exerts a large influence on yield variation. The 2019/20 season provided several weather extremes, Such years can help build understanding of the complex weather effects. Poor (wet) overwinter rooting conditions, followed by dry topsoil conditions, will no doubt have inhibited nutrient availabilities and influenced uptake. It is possible that the main effect of poor rooting will be more on water capture, rather than nutrient capture. Dry topsoils in spring can seriously inhibit nutrient uptake.
Do grain nutrient results relate to cultivation?
There is increased interest in fine-tuning nutrient management under various cultivation systems. Some suggest that reduced cultivation (e.g. min till) alters soil biology and this could help crops salvage P more efficiently. Although information to confirm this is lacking, YEN is collecting data that could help provide an answer.
Do critical thresholds for grain nutrients vary between soil type/pH?
Probably not. Soil type and pH may affect crop nutrient capture but not the ability to use them once taken up. Therefore, critical thresholds in grain are mainly influenced by crop characteristics.
Has the influence of ear pathogens been considered?
The embryo, which is formed first, holds most grain nutrients. However, N and S help form proteins, which are mainly in the endosperm, and ear pathogens may affect these. Consequently, diseased crops may have less endosperm (N and S) and relatively high concentrations of other grain nutrients.
Are there pre-harvest critical values?
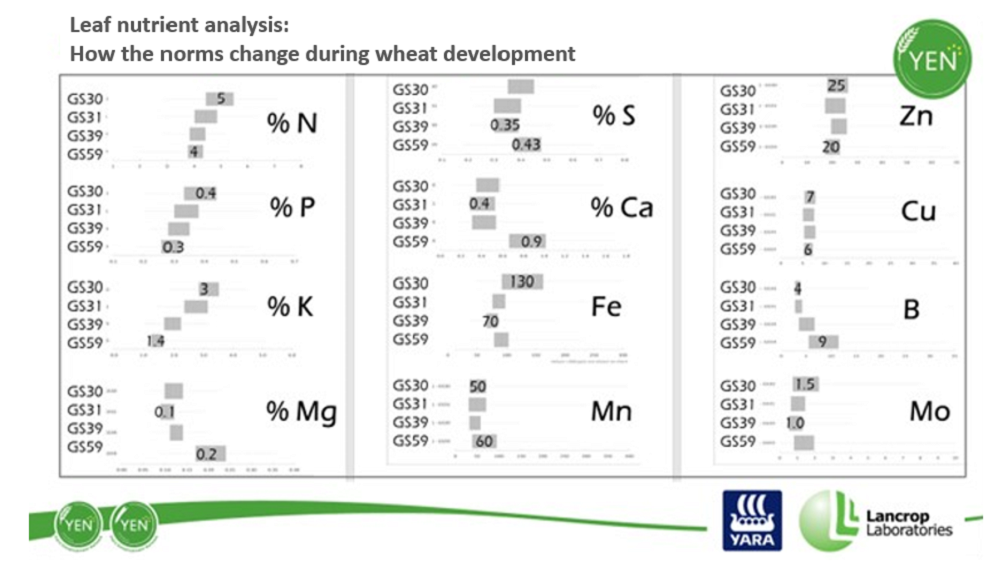
There is some limited data on critical P during growth, with critical values typically less than in the grain. However, the part of the plant sampled and the growth stage at which sampling takes place affect results. Consequently, the retrospective analysis offered by grain nutrient analysis is the more reliable (consistent) approach, at present.
YEN 2019 leaf sample analysis results demonstrate this point. In the chart, the norms – grey boxes representing the middle half of all values – change during wheat development. Importantly, these norms do not reveal critical values (only the potential spread of values).

What about nutrients removed in straw?
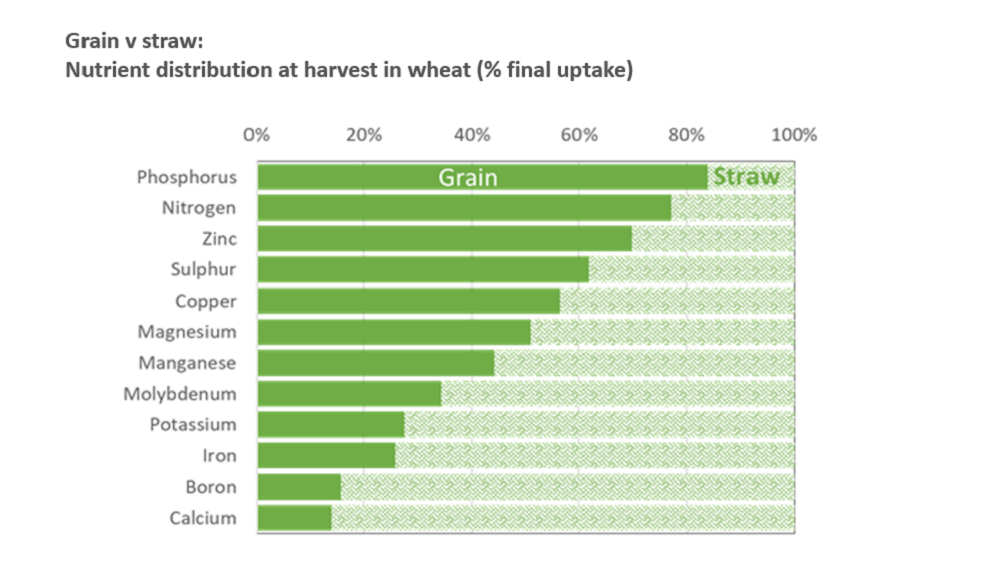
It is important to consider all significant nutrient removals from the land at harvest. The only nutrients that might be returned from the crop to the land before harvest are potassium and boron.
However, in almost all crops, uptake of nutrients is maximal at harvest. For cereals, nutrients are held either in the straw or the grain, with the distribution dependent on the nutrient (as shown below). For nutrients held mostly in the grain, like phosphorus, grain analysis is sufficient.
Just like leaf and grain samples, straw can be analysed too. However, whole-crop analysis is not advised, due to difficulties associated with both sampling and analysis. A straw analysis may be worthwhile, with potassium the most valuable nutrient to assess (due to its relative abundance in straw). This is particularly true when significant spend on fresh potash is planned. As some nutrient levels change during ripening (e.g. potassium), it is best to sample straw on the day of baling.

Do the principles of crop nutrient analysis apply to other crops?
What we learn from cereals can be applied to other crops, such as field vegetables, potatoes, oilseeds and pulses.
Critical thresholds have not been set for many crops. In their absence, benchmarking against other concurrent crops is the most reliable way to interpret analyses.
If a crop’s area is 8 hectares (20 acres) or more, representative analyses of any harvested crop should be worthwhile to measure offtakes accurately and fine-tune nutrient management plans. In fact, smaller crop areas will be worth sampling, the higher the value of the crop.
Will the guidance change?
RB209 is based on the latest and best available information, so is the definitive source of nutrient management information for UK farms. Feedback from farmers, growers, advisers and agronomists helps shape the guidance. Randomised replicated (commercial and independent) trials, conducted across the country under varying soils and environmental conditions, generate results for consideration by the AHDB Nutrient Management Partnership. Where the evidence for change is robust, recommendations are revised and published at ahdb.org.uk/rb209
RB209 for arable crops (section 4)
Further information

Grain nutrient analysis and benchmarking
Measurements of grain nutrients could help you fine-tune management

