- Home
- Markets and prices
- Dairy markets - Imports and exports - UK dairy trade
-
Beef markets
- Beef markets home
- Market analysis
- Prices
- Supply and demand
- Imports and exports
- Cost of production and performance
-
Lamb markets
- Lamb markets home
- Market analysis
- Prices
- Supply and demand
- Imports and exports
- Cost of production and performance
-
Pork markets
- Pork markets home
- Market analysis
-
Prices
- Deadweight pig prices
- EU weaner prices
- Supermarket red meat prices
- Farm costs
- Exchange rates
-
Supply and demand
- Industry structure
- Slaughter and production
- Carcase information
- Consumption
- Imports and exports
- Cost of production and performance
-
Dairy markets
- Dairy markets home
- Market analysis
-
Prices
- Milk price calculator
- Farmgate milk prices
- Wholesale prices
- Retail prices
- Farm costs
- Exchange rates
-
Supply and demand
- Industry structure
- Dairy production
- Composition and hygiene
- Consumption
- Imports and exports
-
Cereals and oilseeds markets
- Cereals and oilseeds markets home
- Market analysis
- Prices
- Supply and demand
- Imports and exports
- Nature markets
- Retail and consumer insight
- Agri Market Outlook
- Farm standards review
UK dairy trade
Updated December 2025
This page gives quarterly overview of UK dairy trade. For a detailed look at the latest monthly data please visit our dairy trade dashboard.
Latest dairy trade news
Imports


Exports


Overview
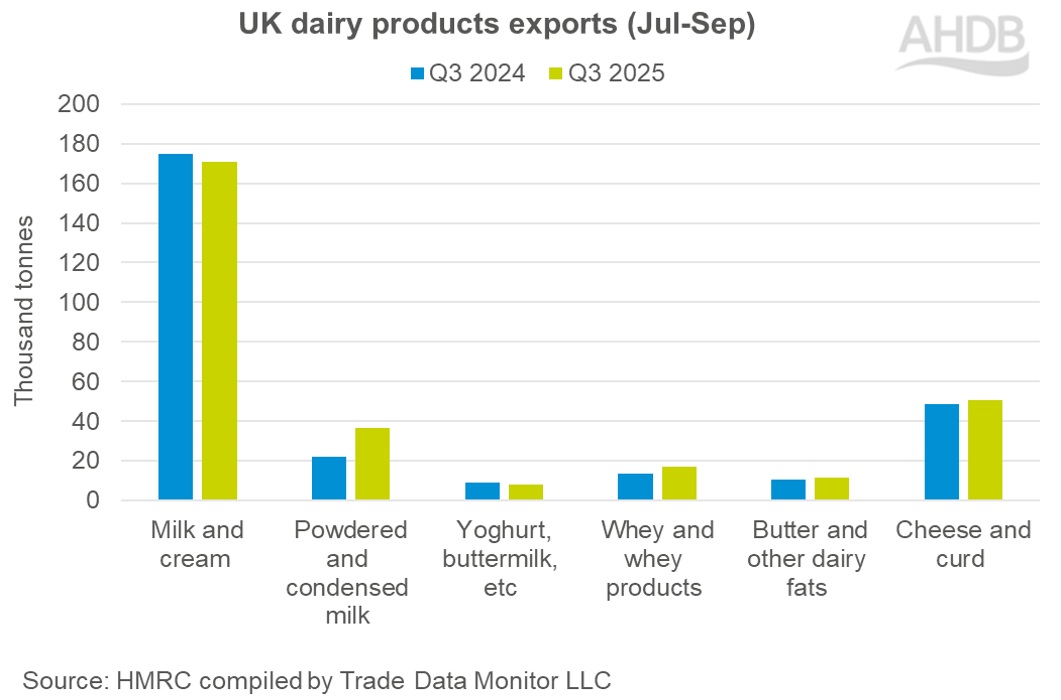
- Total dairy export volume for Q3 2025 was up 5.5% on Q3 2024, at 294.0k tonnes.
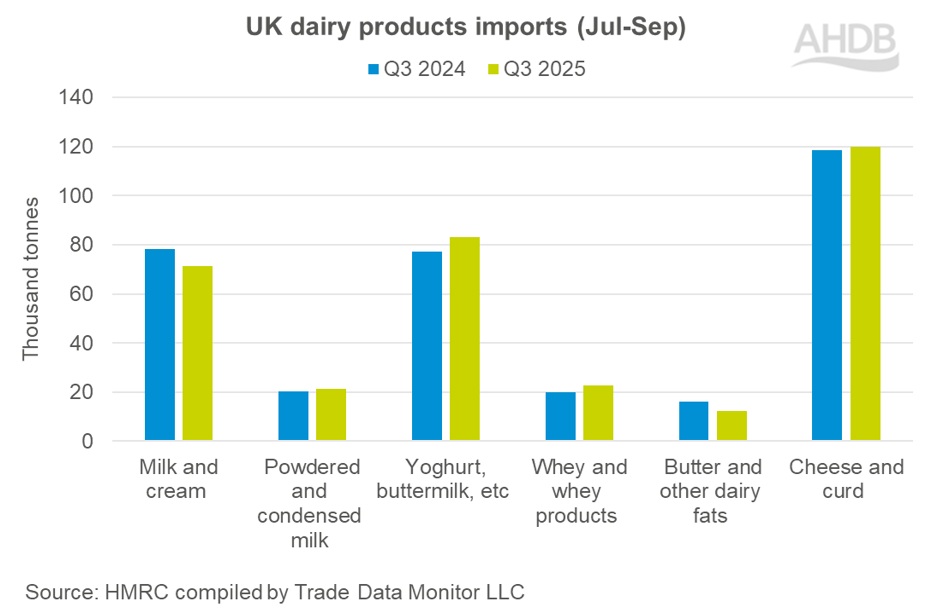
- Total dairy import volume for Q3 2025 was down 0.03% on Q3 2024, at 330.6k tonnes.
- Performance was mixed among the categories. Some categories like exports of powdered and condensed milk were up year-on-year at 36,400t (65%) and whey, whey products up at 17,100t (25.7%) from Q3 2024. Exports of cheese and curd noticed an increase of 3.1% followed by butter at 8.5%. Milk and cream and yoghurt witnessed a decline of 2.2% and 10.7% respectively during the period.
- Dairy wholesale prices, both domestic and global have been declining during the last few months. However, uncertain geopolitical factors in the global market will continue to influence trade flows.
Additional information
Further publication of the trade flow information is prohibited unless expressly permitted by Trade Data Monitor LLC.
While AHDB seeks to ensure that the information contained on this webpage is accurate at the time of publication, no warranty is given in respect of the information and data provided. You are responsible for how you use the information. To the maximum extent permitted by law, AHDB accepts no liability for loss, damage or injury howsoever caused or suffered (including that caused by negligence) directly or indirectly in relation to the information or data provided in this publication.
All intellectual property rights in the information and data on this webpage belong to or are licensed by AHDB. You are authorised to use such information for your internal business purposes only and you must not provide this information to any other third parties, including further publication of the information, or for commercial gain in any way whatsoever without the prior written permission of AHDB for each third party disclosure, publication or commercial arrangement. For more information, please see our Terms of Use and Privacy Notice or contact the Director of Corporate Affairs at info@ahdb.org.uk © Agriculture and Horticulture Development Board. All rights reserved.

