- Home
- Breeding flocks: An unexpected insight from top Farmbench performers
Breeding flocks: An unexpected insight from top Farmbench performers
UK farming systems are incredibly diverse. Why do comparable farms, with comparable systems, perform so differently?
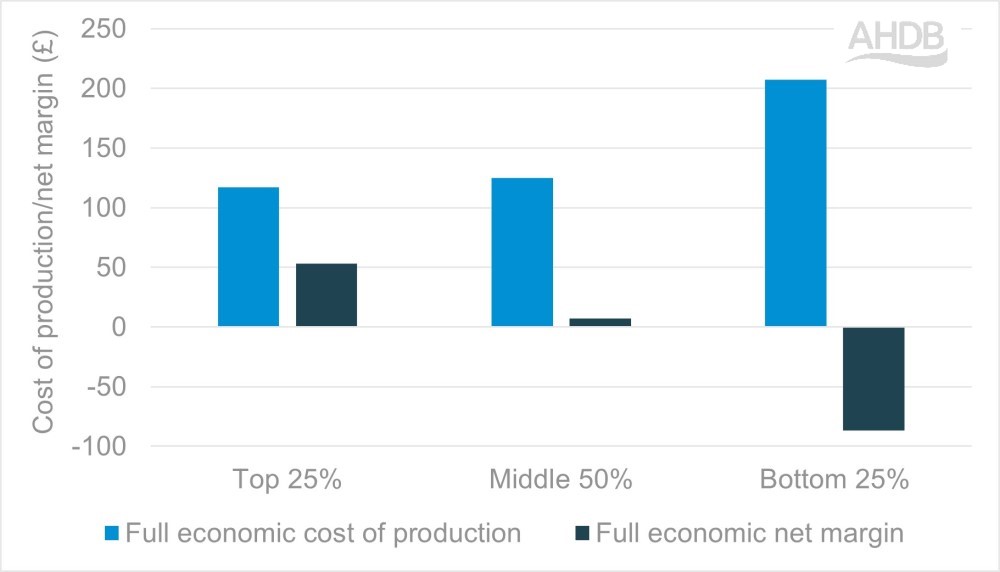
Within a time of changing agricultural policy and economic instability, profitability is key. Yet, according to Farmbench data, the bottom 25% of breeding sheep flocks make an £86.81 loss on every ewe put to the ram, while the top 25% make £53.37 profit.
Is it just that the top performers do more to minimise costs in order to maximise output? Whatever the answer, Farmbench can help you gather your own data and discover how your enterprise performs compared with the rest.
More feed equals higher DLWG? Think again!
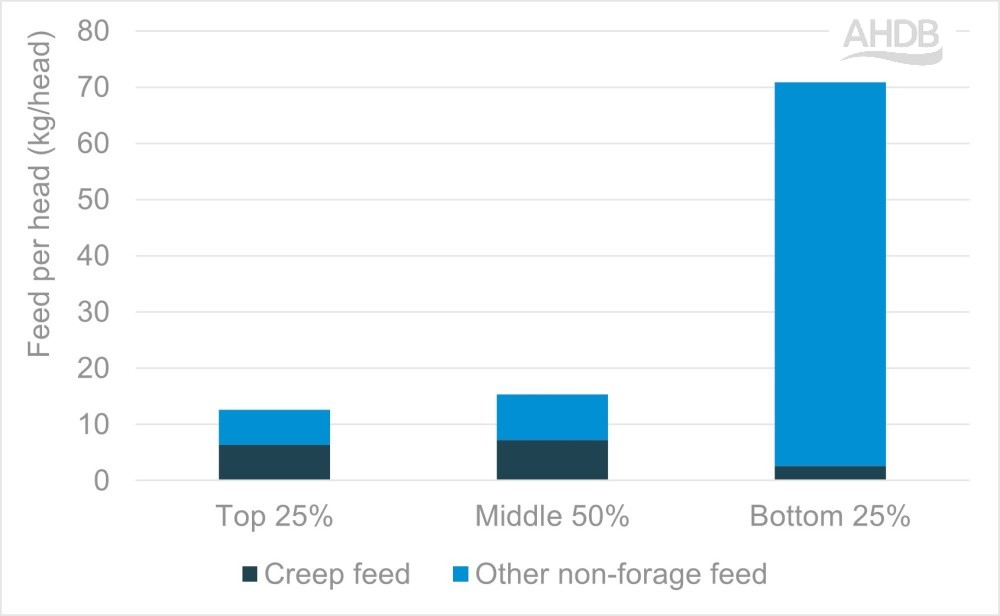
An analysis of 35 breeding flock enterprises from 2021/22 Farmbench data showed two surprising interrelationships between feed use and daily liveweight gain (DLWG):
- The top-performing farms fed 82% less non-forage feed than the bottom 25%, yet they achieved 20% higher overall DLWG at 0.24kg/day as opposed to 0.20kg/day
- While overall levels of non-forage feed were lower among the top performers, 51% of this comprised creep feed; this is significantly higher than just 4% among the bottom 25%
Figure 1. Quantities of creep and other non-forage feed used by Farmbench users

Source : AHDB Farmbench data 2021/22
How do the economics stack up?
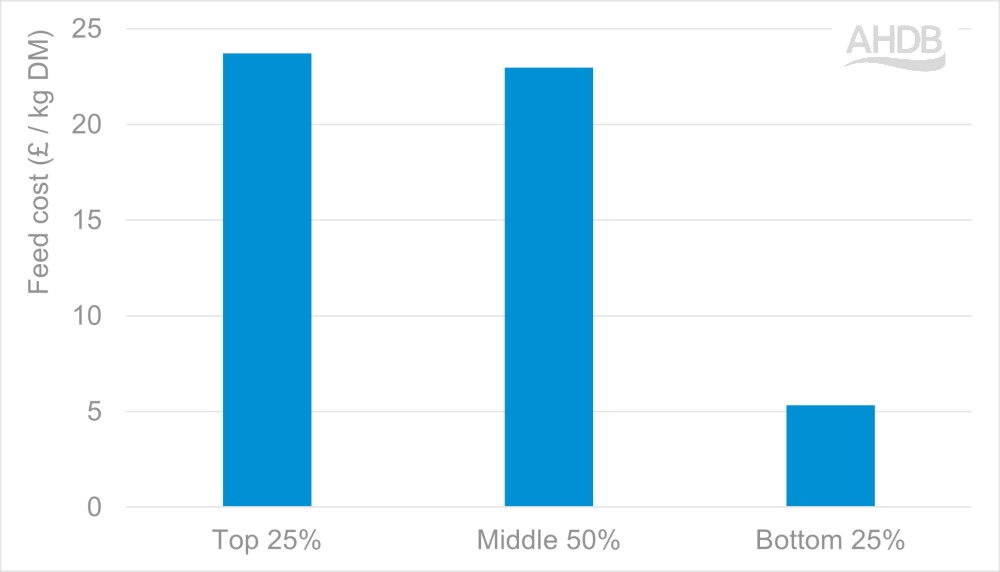
Farmbench data showed that while top performers utilised lower quantities of non-forage feed, they spent over four times as much per kilogram of dry matter fed compared to the bottom 25% of enterprises, as shown in Figure 2.
Figure 2. Cost per kg of dry matter (DM) of non-forage feed for Farmbench users

Source: AHDB Farmbench data 2021/22
The relationships between cost of feed and use of creep feed suggest that the quality of the feed and when it was fed are key to achieving good, cost-effective growth rates.
The booklet Growing and finishing lambs for Better Returns provides guidance on weaning, grazing and feed requirements for both ewes and lambs.
What does it take to become a top performer?
According to our 2021/22 Farmbench data (see Figure 3), top performers consistently had lower costs of production. The cost of production for the middle 50% was similar to the top 25%; however, these lower costs were not proportionally converted into higher margins.
This indicates that farms must both minimise costs and hit animals’ key performance indicators (KPIs), such as fertility and DLWG, to be within the top-performing farms.
Figure 3. Full economic cost of production and net margins per ewe put to the ram by Farmbench users

Source : AHDB Farmbench data 2021/22
How can Farmbench benefit your farm?
Our free Farmbench tool allows you to capture all this information within your farming enterprises, compare against other farmers, and identify opportunities for improvement based on your individual situation.
Regional Farmbench managers are on hand to support with data collections, as well as uploading data on your behalf and creating individual enterprise reports containing:
- KPIs
- Technical performance
- Income
- Variable costs
- Overheads
- Cost of production
- Net margins
Get in touch today to see how you too can be a top performer!

