Search our website enhanced by Google.
Friday, 10 May 2024
Yesterday, AHDB released the latest usage figures for both GB animal feed production and human and industrial consumption up to the end of March.
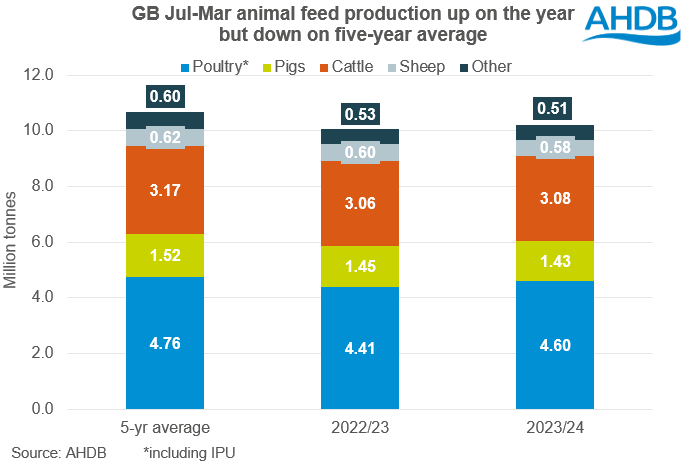
Despite seeing year-on-year climbs in total feed production (including integrated poultry units (IPU)) each month since November, in March, total production fell 0.7% on the year. Each sector including cattle, pig and sheep feed saw a yearly decline in March, with poultry being the only sector to see a rise.
This season-to-date (Jul-Mar), total GB animal feed production (incl. IPU) has totalled 10.20 Mt, up 1.5% on the year, but at the second lowest level since 2015/16. Also, this season-to-date, cattle and poultry feed have seen yearly increases in production levels. However, pigs, sheep and others have seen declines.
Despite a slight increase in GB animal feed production this season so far, usage of wheat, barley, maize and oats by GB compounders is down 1.2% on the year. However, these figures exclude usage by IPU’s (who have seen feed production increase by 15.8% season to date).
Perhaps unsurprisingly, given their lack of availability, oats have seen the greatest decline in usage by compounders (in percentage terms) on the year, down 35.2% July to March. During the same period wheat and maize usage have been down 1.0% and 9.5% respectively. However, following significant declines at the start of the season, maize usage looks to be picking up pace, suggesting the imported grain is pricing more competitively as of late. On the other hand, due to its relative price over other cereals, barley usage is up 3.3% on the year (Jul-Mar).
Wheat usage by IPU’s has seen a slightly different trend to compounders usage, increasing by 17% on the year (Jul-Mar). As with compounders, barley usage is also up in IPU production.
Looking ahead, the next AHDB supply and demand estimates are due out at the end of this month. These will give more insight into what we can expect from usage for the remainder of the season – something to look out for.
Yesterday, AHDB released estimates of cereal stocks held by merchants, ports and co-ops in the UK at the end of February. The data showed stocks of home-grown wheat were up 9% on the year, while stocks of imported wheat were down 2% on the year. Home grown barley and oats stocks were down 15% and 34% respectively as at the end of February. Perhaps unsurprisingly given that maize was less competitive earlier in the season, maize stocks were down 17% on the year. Find the full dataset here.
Also yesterday, Defra published estimates of stocks held on farm in England and Wales. As a proportion of total production, on farm wheat stocks sat at 32%, up from 31% in 2023, and above the five-year average of 30%. On farm barley stocks were in line with average at 18% of total production, and as could be expected oats stocks were much lower than average (24%) with 16% of total production held on farm. See more information here.
Sign up to receive the latest information from AHDB.
While AHDB seeks to ensure that the information contained on this webpage is accurate at the time of publication, no warranty is given in respect of the information and data provided. You are responsible for how you use the information. To the maximum extent permitted by law, AHDB accepts no liability for loss, damage or injury howsoever caused or suffered (including that caused by negligence) directly or indirectly in relation to the information or data provided in this publication.
All intellectual property rights in the information and data on this webpage belong to or are licensed by AHDB. You are authorised to use such information for your internal business purposes only and you must not provide this information to any other third parties, including further publication of the information, or for commercial gain in any way whatsoever without the prior written permission of AHDB for each third party disclosure, publication or commercial arrangement. For more information, please see our Terms of Use and Privacy Notice or contact the Director of Corporate Affairs at info@ahdb.org.uk © Agriculture and Horticulture Development Board. All rights reserved.