
Search our website enhanced by Google.
Back to: Net zero: agriculture and carbon
Carbon sequestration: agriculture
The key GHGs for agriculture that contribute directly to climate change are:
All these GHGs are often grouped under the umbrella term ‘carbon’.
The contribution agriculture makes to global warming varies, dependant on how they are calculated (GWP calculation) and what they include (direct, indirect emissions) and none include the critical contribution of sequestration. According to the Government’s official statistics, using GWP100, agriculture in the UK accounts for 10% of the country’s greenhouse gas (GHG) emissions, equal to about 46.3 Mt of CO2 equivalent (2019). This does not take into consideration the carbon sequestered by farms in the soil, trees and hedges.
Want to know what climate change is? Try this 60 second explainer from the Royal society.
Want to know how greenhouse gases work? Try this video from Encyclopaedia Brittanica
Greenhouse gases are often presented in units of carbon dioxide equivalent (or CO2e). This is a common unit of measurement that allows comparisons to be made between emissions of different greenhouse gases.
Each greenhouse gas can have a different impact on the Earth’s climate. This is because each behaves differently in the atmosphere, namely in their ability to absorb heat and the length of time they exist for in the atmosphere (or their “lifetime”).
CO2 is the most abundant greenhouse gas emitted by human activity, and so is used as a “benchmark” against which emissions of other greenhouse gases are compared.
Non-CO2 greenhouse gases are converted into CO2e by multiplying the quantity of gas emitted by the global warming potential (GWP) of that gas. The GWP of a gas is its heat-absorbing ability compared to CO2 over a fixed timeframe. As CO2 is the benchmark, it always has a GWP of 1.
A timeframe of 100 years (GWP100) is currently the most common method used to calculate emissions of GHGs. The GWP100 value for non-fossil methane is 27, meaning that methane has 27x more global warming potential than CO2. Nitrous oxide has a GWP100 value of 273, meaning it has 273x the warming potential of CO2.
However, GWP100 misrepresents the impact that “short-lived” GHGs, like methane, have on the Earth’s climate. This is important when considering the impact of agricultural emissions, which are mostly of methane, in comparison to emissions from other sectors that are mostly CO2, such as transport.
GWP* is a newer method of calculating methane’s warming impact that better accounts for its short lifespan. However, GWP* has not yet been adopted as an official measure. As such, comparisons both within the UK, and against other countries are not as fully developed. This means most comparisons are calculated using the officially recognised GWP100 measure.
The information below comes from a mix of official statistics and scientific studies. All of these follow standardised GHG accounting methodologies. Official reporting standards report in GWP100, and also include methane from enteric fermentation in their calculations, despite it being relatively short-lived and part of natural cycles. Additionally, figures are generally calculated by combining farm activity data with Tier 1 and 2 emissions factors (international and national averages), instead of physically measuring the emissions from specific farms.
Until more granular data and data under alternative GWP measures is available, care should be taken with the conclusions being reached by the GWP100 numbers.
All figures below use 2019 data. While data up to 2021 is now available, more recent figures are skewed by the impact of the Covid-19 pandemic. 2019 better reflects how agriculture compares to other sectors in a ‘normal’ year.
For those looking to reduce emissions, the key is to find the win-wins. The areas where improved environmental impact also leads to improved profitability, or vice versa. The focus areas will be different for each farm. They could include improving genetics and herd health (livestock only) or improving soil pH to increase carbon sequestration. Taking methane emissions aside, a good starting point would be the three Fs – fuel, fertiliser and feed. The carbon output for each will vary from sector to sector. i.e. fertiliser will be the highest carbon output in arable with feed being the highest in pork – each of which would also have a high financial input.
A reduction in fertiliser use in particular, in addition to carbon sequestration, can lead to wider environmental improvements around biodiversity, diffuse pollution and waste management etc. AHDB has a range of products, tools and services to help farmers in making these reductions, including GREATsoils to get the most out of soils, cost calculator to strike a balance with inorganic fertiliser reduction, AHDB Grass to get the most out of grassland and breeding and genetics indexes for long term, permanent sustainability.
AHDB’s EnviroCow is a genetic index designed to help farmers breed cows with longer lifespans and improved production, fertility and feed efficiency - which also leads to reduced emissions per kilo of milk (FPCM).
We will be providing further information on this going forwards.
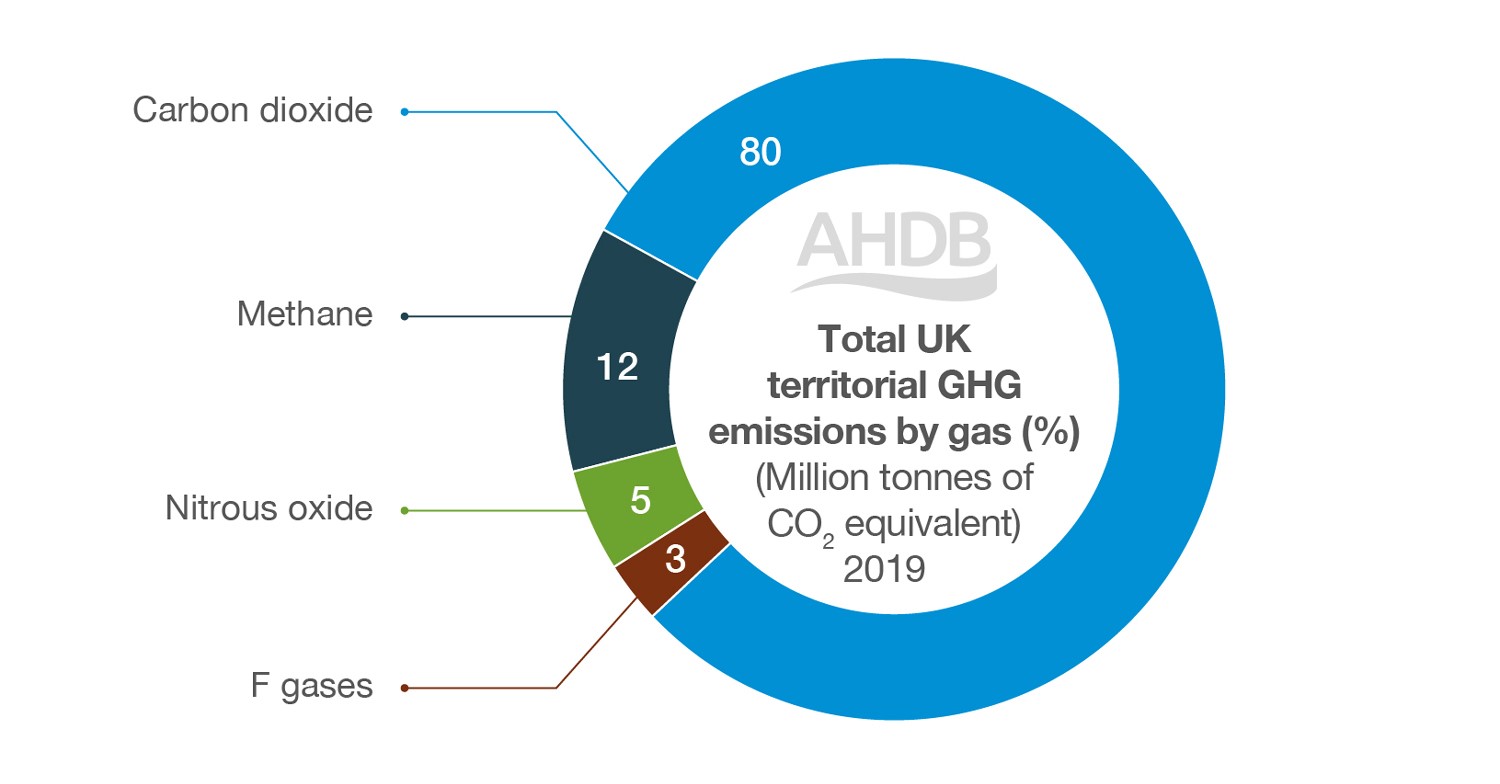
Figure 1. Total UK territorial GHG emissions by gas (2019) (Million tonnes of CO2 equivalent, using GWP100)
Figures last updated: 26 May 2021
Notes: Total estimated UK territorial greenhouse gas emissions in 2019 were 454.8 MT CO2e
Source: Department for Business, Energy & Industrial Strategy, 2019
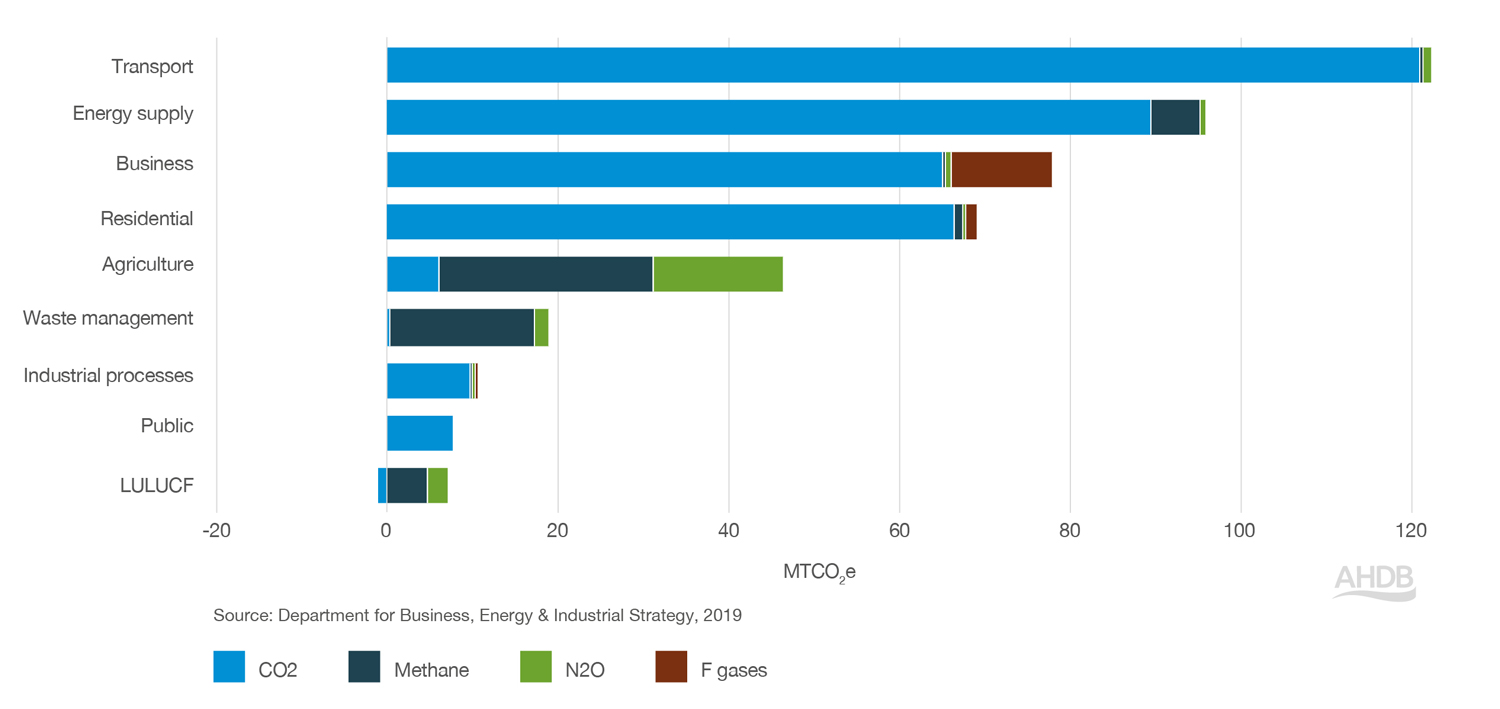
In the UK (2019), it is estimated that 10% of the country's total GHG emissions came from agriculture, equivalent to 46.3 Mt CO2e per year.
Emissions from transport (27%), energy supply (21%), business (17%) and residential (15%) were all higher than those from agriculture.
The main GHG emitted from agriculture was methane from ruminants* (56%), followed by nitrous oxide from fertilisers (31%) and carbon dioxide predominantly from energy and fuel (13%).
It is estimated that agriculture is responsible for 47% of the UK's methane emissions*, 68% of the UK's nitrous oxide emissions, and just 2% of the UK's carbon dioxide emissions.
*International reporting standards include methane from enteric fermentation in their calculations, despite it being relatively short-lived and part of natural cycles.
All Governments must report annually against agreed International GHG reduction targets. The GHG National Inventory is the vehicle used to do this. Farm businesses don’t fit within the inventory – their activities are potentially split between 4 different inventories:
There is currently no recognition of how these silos interact at a farm business level, so its difficult to get an overall picture of emissions and sequestration for the whole farm business.
Figure 2. Total UK territorial GHG emissions by gas and sector (2019) (Million tonnes of CO2 equivalent, using GWP100)
Figures last updated: 26 May 2021
Notes: LULUCF = Land Use, Land Use Change and Forestry. Total estimated UK territorial greenhouse gas emissions in 2019 were 454.8 MT CO2e
Source: Department for Business, Energy & Industrial Strategy, 2019
Due to the different production systems used, GHG emissions vary between farming sectors. We have previously gathered data on the carbon footprints of English beef and sheep sectors and GB pork and dairy sectors, which show the GHG emissions per kg of product or the ’emissions intensity’ of that product.
It is important to note that these figures cover the emissions produced up until the product leaves the farm and do not include those emissions produced further down the supply chain (in processing, transport and packaging, for example).
Table 1. Overall average GHG emissions intensity of livestock products, by unit of production up to the farm gate (GWP100)
|
|
Beef (England, 2012) |
Lamb (England, 2012) |
Pork (GB, 2018) |
Dairy (GB, 2014) |
|
kg CO2e/kg carcase weight (deadweight) |
kg CO2e/litre of 4% fat-corrected milk |
|||
|
Average |
23.4 |
25.2 |
4.8 |
1.2 |
|
Lowest |
5.6 |
13.7 |
- |
0.8 |
|
Highest |
55.0 |
41.9 |
- |
2.1 |
Data refers to emissions produced up until the animal/product leaves the farm gate. A date range was not reported in the pork study.
Source: Figures from studies comissioned by AHDB.
Figures last updated: 18 January 2021.
The IPCC's Special Report on Climate Change and Land (2019) estimates that, globally, agriculture is directly responsible for up to 8.5% of all greenhouse gas emissions with a further 14.5% coming from land use change (mainly deforestation in the developing world to clear land for food production).
The two biggest sources of greenhouse gases from agriculture are:
While energy use in agriculture (for example, diesel for cultivation) is important, its contribution to greenhouse gas emissions is much lower, less than 1.5% of total emissions.
*International reporting standards include methane from enteric fermentation in their calculations, despite it relatively short-lived and part of natural cycles.
